Products
SentimenTrader Trading Tools
‍
Backtest Engine
My Trading Toolkit
Correlation Analysis
Seasonality
Market Prediction
Indicators & Data API
‍
Proprietary Indicators & Charts
Market Data API
Strategies & Scanner
‍
50+ Trading Strategies
Smart Stock Scanner
Smart Option Scanner
Research Reports
‍
Research Solutions
Reports Library
Free Resources
Simple Backtest Calculator
Simple Seasonality Calculator
The Kelly Criterion Calculator
Sentiment Geo Map
Public Research Reports
Education
Sentiment Indicators
Technical Indicators
Pricing
Company
About
In the News
Testimonials
Client Success Stories
Contact
Log inLoginSign up
< BACK TO ALL REPORTS

A bullish skew in NYSE breadth

Dean Christians
2024-07-15
Over successive trading sessions, advancing issues on the NYSE outnumbered declining issues by a wide margin, with the S&P 500 hovering near a high. Similar market breadth skews produced excellent returns and consistency for the world's most benchmarked index.

Key points:

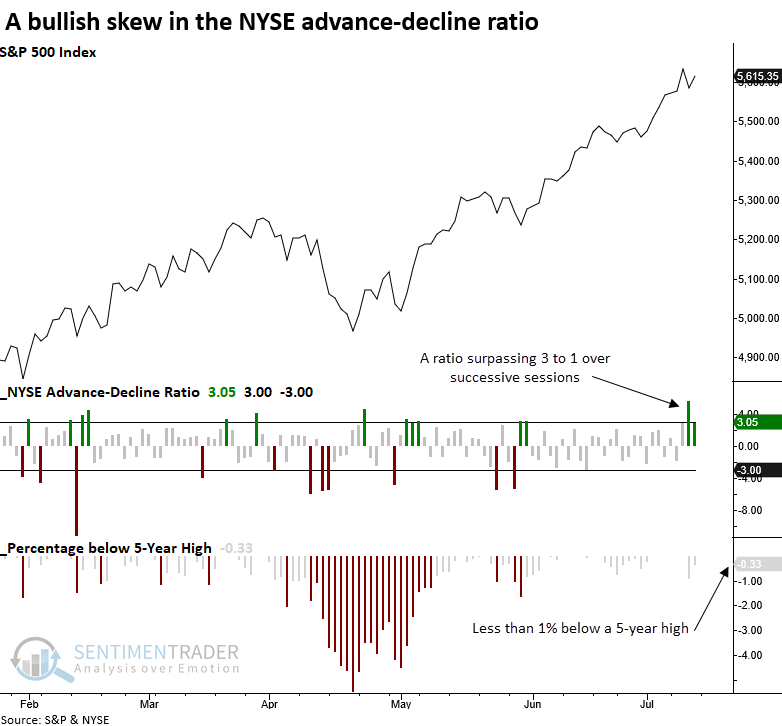
  • The NYSE advance-decline ratio increased by a significant amount over consecutive sessions near a high
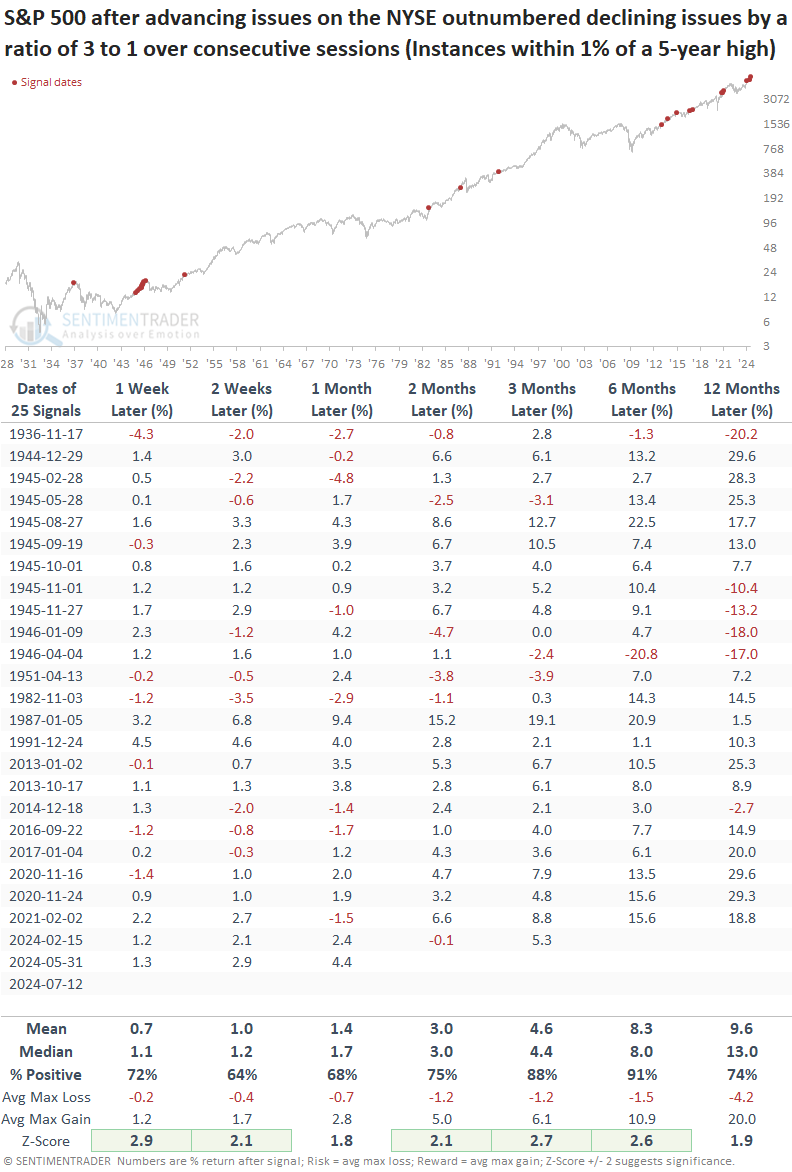
  • Similar breadth skews preceded outstanding returns for the S&P 500 over the subsequent six months
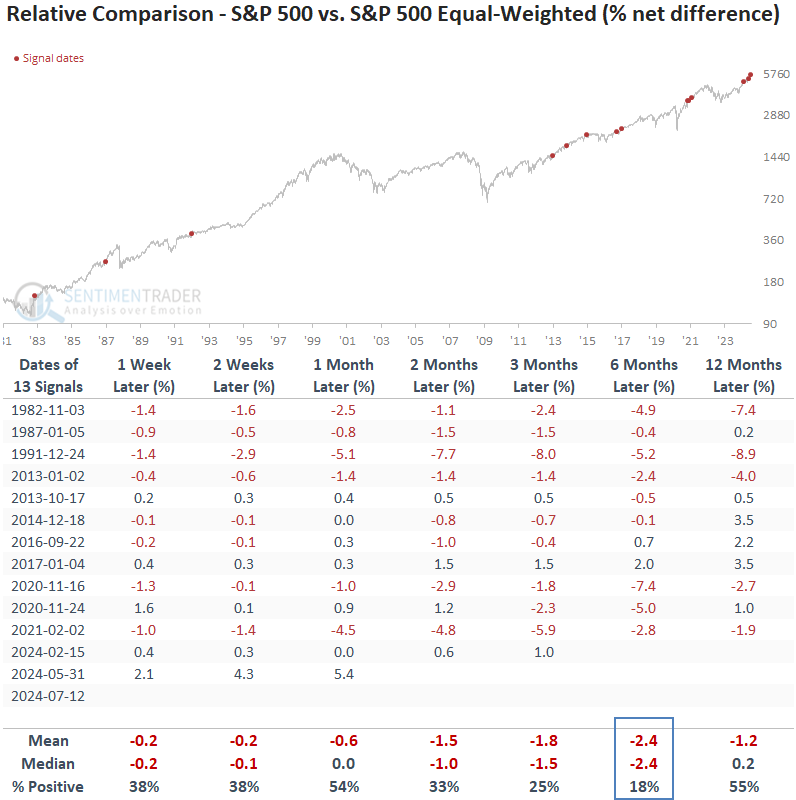
  • Historically, the equal-weighted S&P 500 has tended to outperform the cap-weighted version

An expansion in participation bodes well for the uptrend

Following a dovish CPI report last week, investor optimism shifted, breathing new life into previously overlooked stocks and enhancing participation across various market capitalizations. 

For only the 26th time since 1936, advancing issues on the NYSE outpaced declining issues by a ratio of 3 to 1 over successive trading sessions, with the S&P 500 hovering within 1% of a 5-year high. 

The two previous instances occurred in February and May of this year, leading to solid gains thus far.

Similar breadth skews preceded excellent returns

Whenever advancing issues on the NYSE exceeded declining issues by a ratio of 3 to 1 over consecutive sessions with the S&P 500 within 1% of a 5-year high, the world's most benchmarked index displayed outstanding returns and consistency over the following six months. 

Furthermore, the outlook has been increasingly bullish since 1951, with several periods demonstrating a perfect 100% win rate. 

While a comparison between the S&P 500 and the S&P 500 Equal-Weighted Index contains fewer precedents due to data limitations, the outlook table suggests investors should be open to the possibility that the average stock outperforms the cap-weighted benchmark in the next six months. Over this period, the equal-weighted S&P 500 outperformed the cap-weighted version 82% of the time. 

A potential rubberband snapback scenario

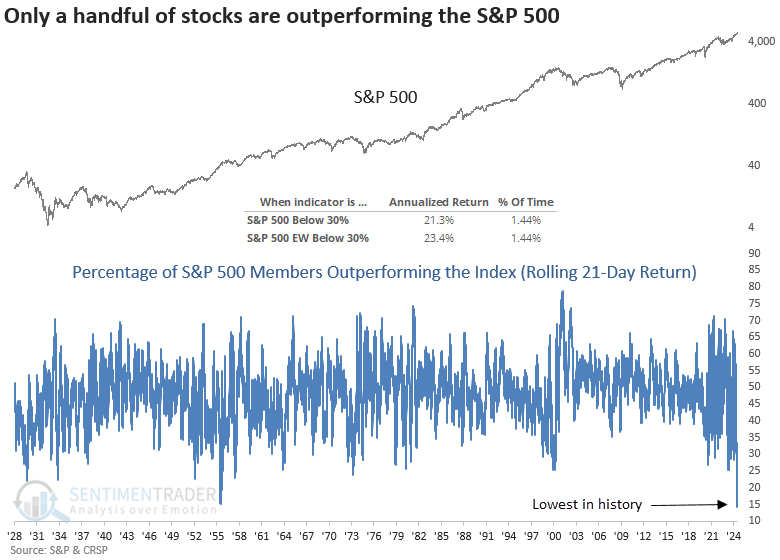
On July 5th, the percentage of S&P 500 stocks outperforming the S&P 500 Index over a rolling 21-day period fell to the lowest in history. In the past, whenever this indicator drops under 30%, the equal-weighted S&P 500 index has generated an annualized return of 23%, exceeding the cap-weighted return of 21%.  

What the research tells us...

Following a favorable CPI report last week, stocks across all market capitalization surged over two days, culminating in a favorable skew in the advance-decline ratio on the NYSE. Comparable market breadth dynamics near a 5-year high produced outstanding results for the S&P 500. While an expansion in participation typically favors the equal-weighted S&P 500 over the cap-weighted version, we must remember that significant sector or style rotations more often than not occur at major bottoms or tops in the broad market, not during steady uptrends. A recent example would be 2022 when the equal-weighted S&P 500 outperformed as the Technology sector weighed on the S&P 500.

PRODUCTS
SentimenTrader
Trading Tools
Indicators & Data API
‍
Strategies & Scanner
‍
Research Reports
FREE
RESOUrCES
Simple Backtest
Calculator
Simple Seasonality
Calculator
The Kelly Criterion
Calculator
Sentiment Geo Map
‍
Public Research Reports
‍
Education
Sentiment Indicators
‍
Technical Indicators
‍
Pricing
Bundle pricing
‍
FAQ
‍
Announcements
‍
COMPANY
‍
About
‍
In the News
‍
Testimonials
‍
Client Success Stories
CONTACT
‍
General Inquiries
‍
Media Inquiries
‍
Financial Professionals Inquiries
‍
© 2026 Sundial Capital Research Inc. All rights reserved.
Setsail Marketing
TermsPrivacyAffiliate Program
Risk Disclosure: The information and tools provided are for research and analytical purposes only and are not intended as investment advice. Market analysis involves uncertainty, and outcomes may differ from expectations. Users should conduct their own due diligence and consider their individual circumstances before making any financial decisions. Past performance is not necessarily indicative of future results.

Hypothetical Performance Disclosure: Hypothetical performance results have many inherent limitations, some of which are described below. No representation is being made that any account will or is likely to achieve profits or losses similar to those shown; in fact, there are frequently sharp differences between hypothetical performance results and the actual results subsequently achieved by any particular trading program. One of the limitations of hypothetical performance results is that they are generally prepared with the benefit of hindsight. In addition, hypothetical trading does not involve financial risk, and no hypothetical trading record can completely account for the impact of financial risk of actual trading. for example, the ability to withstand losses or to adhere to a particular trading program in spite of trading losses are material points which can also adversely affect actual trading results. There are numerous other factors related to the markets in general or to the implementation of any specific trading program which cannot be fully accounted for in the preparation of hypothetical performance results and all which can adversely affect trading results.

Testimonial Disclosure: Testimonials appearing on this website may not be representative of other clients or customers and is not a guarantee of future performance or success.