
A Bullish Signal Triggered by Industrial Stocks

Key Points:
- A model comparing the equal-weighted S&P 500 Industrial sector to the S&P 500 Index has triggered a buy signal.
- Similar relative trend signals from cyclical sectors have led to bullish outcomes for the broader market.
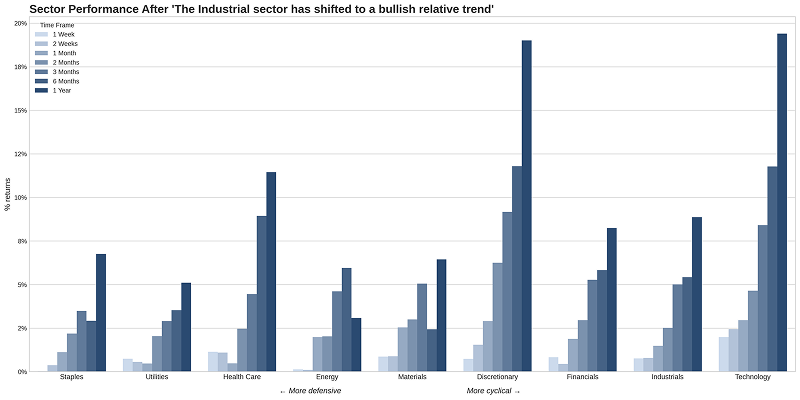
- Cyclical sectors tend to outperform defensive sectors.
A Bullish Market Signal from the Industrial Sector
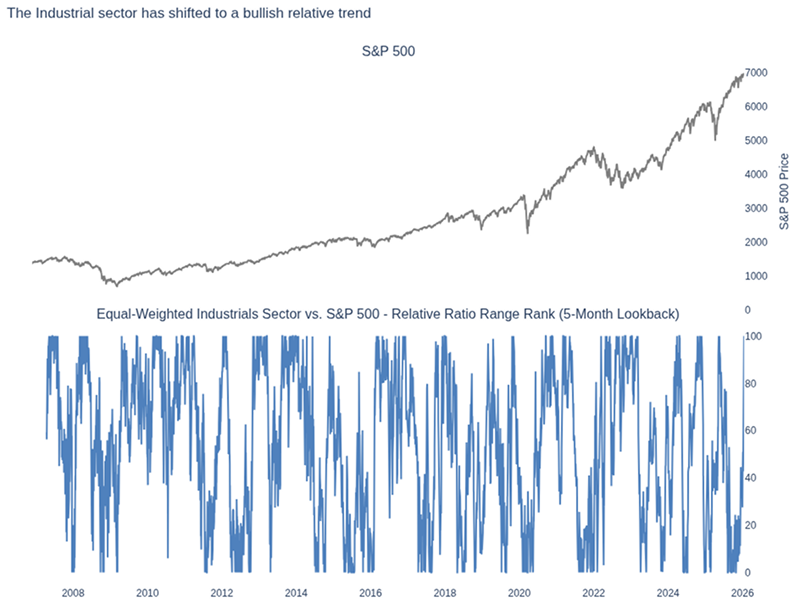
Last week, the stock prices of the S&P 500 Industrial sector hit new highs. Meanwhile, a relative price trend model that compares the equal-weighted S&P 500 Industrial sector with the S&P 500 Index issued a new buy signal, indicating that industrial sector stocks on average outperform the S&P 500 Index. While indicators based on price or market breadth are more commonly used tools to assess the outlook of an index, relative trends can also powerfully reflect the direction of the market or business cycle.
The equal-weighted Industrial sector has historically provided superior insights into the broader market, outperforming all other equal-weighted sectors. As such, the relative price trend model is a component of the TCTM Composite Confirmation Model.
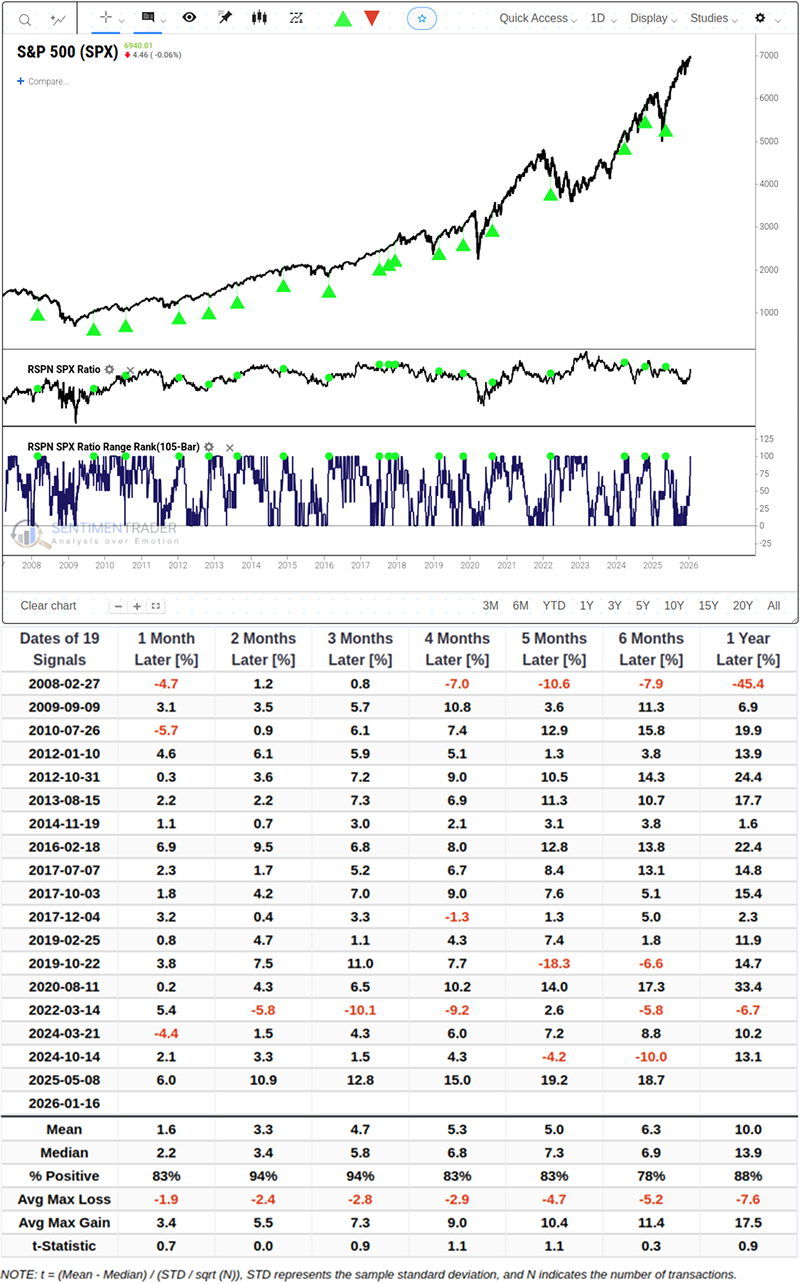
Similar relative trend characteristics have delivered excellent results for the S&P 500 Index.
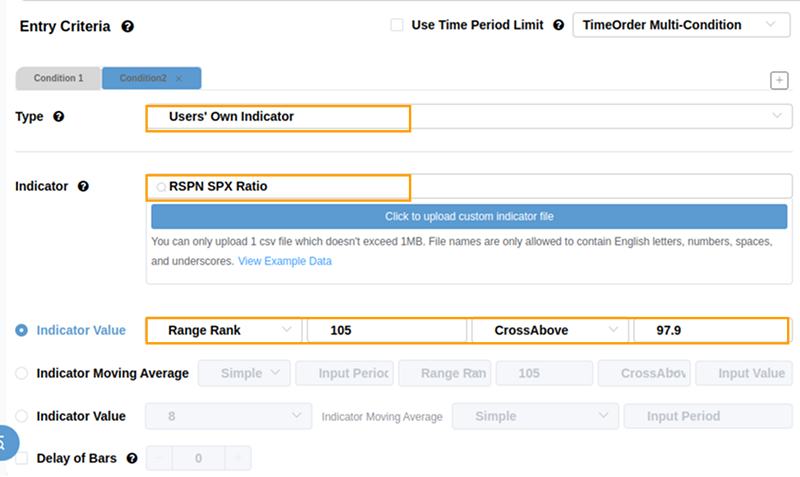
When the relative ratio of the equal-weighted S&P 500 Industrial Sector to the S&P 500 Index rises from the bottom of its five-month range to the 98th percentile, the S&P 500 Index often achieves exceptional returns and win rates.
However, it should be objectively noted that the 19 samples span nearly two decades, representing a relatively limited sample size from a statistical perspective. The high win rate observed in historical data reflects not only the strategy's effectiveness but also incorporates specific market environment factors. Therefore, it is not advisable to rely solely on this data as the sole basis for decision-making.Related Backtest Click Here.
Overall, cyclical sectors outperform defensive sectors, a trend that often emerges during stock market recoveries.
Website Tools Page
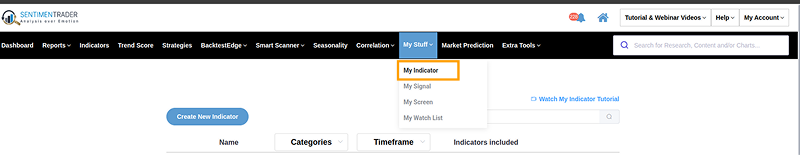
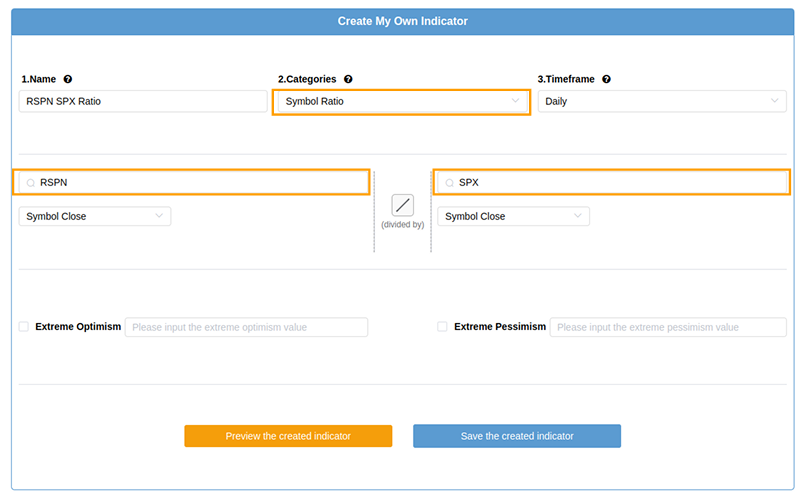
If you haven't used the website's new Backtest Tools page yet, we recommend exploring its features, which are interconnected to help you build a workflow from strategy validation to signal tracking. The content below briefly describes how to use My Indicator to build the RSPN / SPY Ratio, use this indicator in backtesting to replicate this signal, and finally add it to My Signal for tracking.
- Click here My indicator to create the corresponding indicator as shown in the figures below
- Use this indicator in BacktestEdge, apply its 5-month Range Rank, and set the corresponding conditions
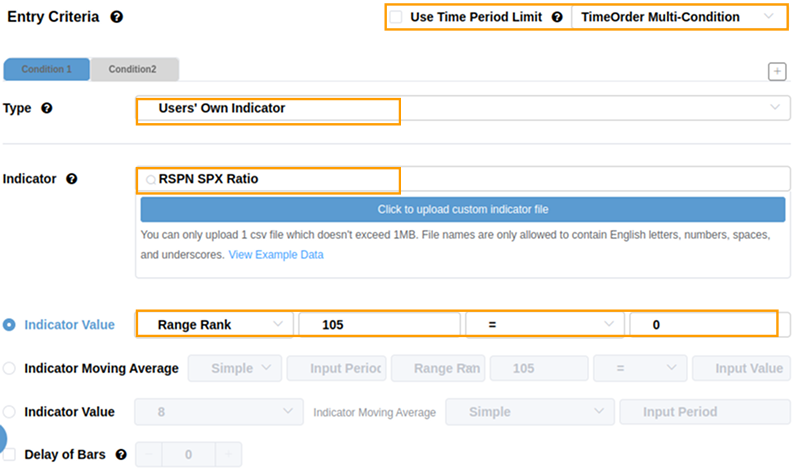
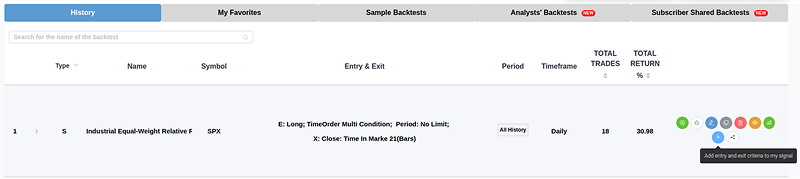
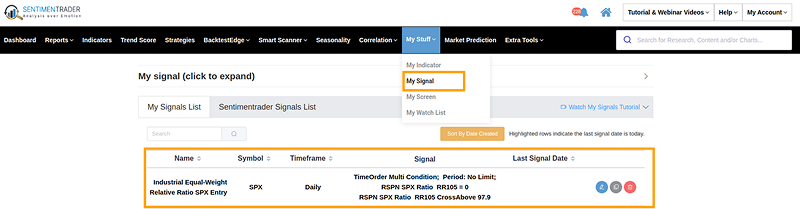
- Follow the steps below to add the entry conditions of this backtest as a signal to My Signal
What the Research Tells Us...
Industrial sector stocks are often regarded as a barometer of economic activity, reflecting the demand for goods and services across various industries. When these stocks exhibit positive relative strength against the broader market, it may indicate that businesses are investing in capital goods, manufacturing is improving, and consumer demand may also be on the rise. A trading model that captures this real-time market signal has triggered a new buy signal. Similar precedents suggest an optimistic outlook for the sustainability of the S&P 500 Index's upward trend.