
A bullish signal from the average Industrial stock

Key points:
- A model that compares the equal-weighted S&P 500 Industrials sector to the S&P 500 triggered a buy signal
- Similar relative trend signals from the cyclical sector produced bullish outcomes for the broad market
- Equal-weighted cyclical sectors tended to outperform market-capitalization-weighted groups
A bullish market message from the industrial sector
Over the last month, I've highlighted a signficant uptick in new highs from cyclical-oriented sectors like Financials and Industrials. When cyclical sectors show healthy participation trends, like now, it's usually a good sign for the overall market.
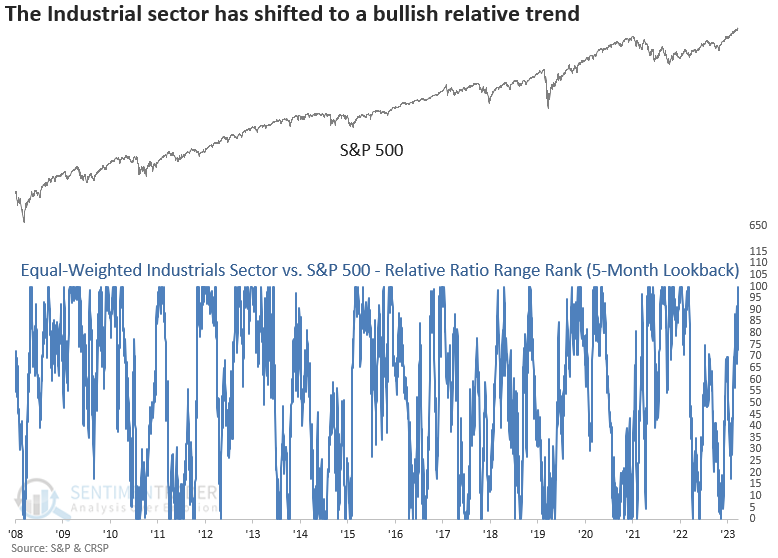
Amidst last week's surge in new highs, a relative price trend model that compares the equal-weighted S&P 500 Industrials sector to the S&P 500 triggered a new buy signal, indicating outperformance from the average Industrial sector stock. While price or breadth-based indicators are typically a more popular tool for assessing the outlook for indexes, relative trends can also provide an equally powerful message about the market or business cycle.
The equal-weighted Industrials group has historically provided an outstanding broad market message, exceeding performance trends for all other equal-weighted sectors. For this reason, the relative price trend model is a component of the TCTM Composite Confirmation Model.
Similar relative trend profiles produced excellent results for the S&P 500
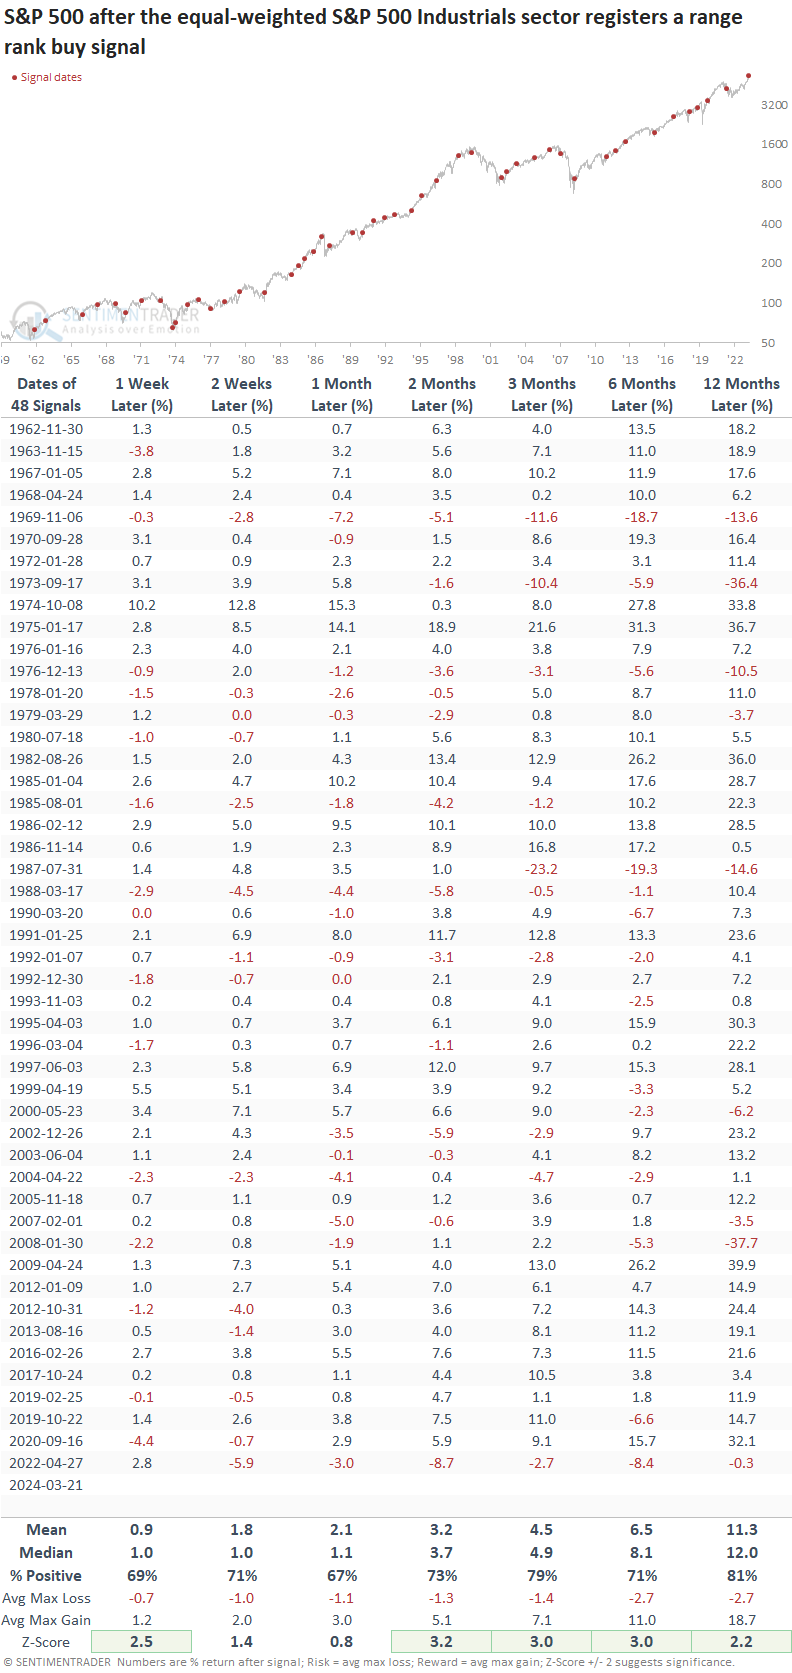
When the relative ratio between the equal-weighted S&P 500 Industrials sector and the S&P 500 shifted from the bottom of its 5-month range to the 98th percentile, returns and win rates for the S&P 500 were excellent, with 5 out of 7 horizons showing gains that were signficant relative to the study period.
I could find only two other precedents that triggered at an all-time high like now: July 1980 and July 1987. While it's hard to draw much of a conclusion from a sample size of two, the world's most benchmarked index exhibited gains over the subsequent two months.
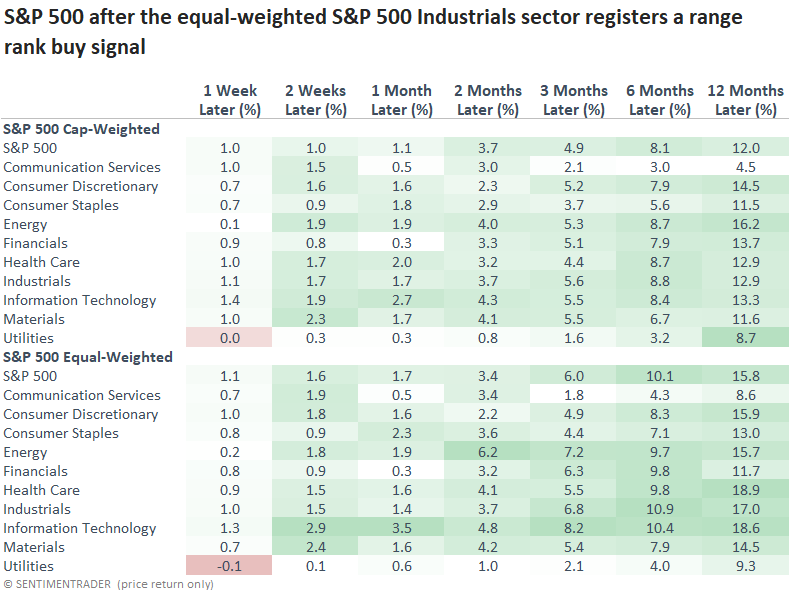
In general, cyclical sectors performed better than defensive groups, and equal-weighted indexes yielded better returns than cap-weighted ones, a trend often observed during stock market recoveries.
Website strategies page
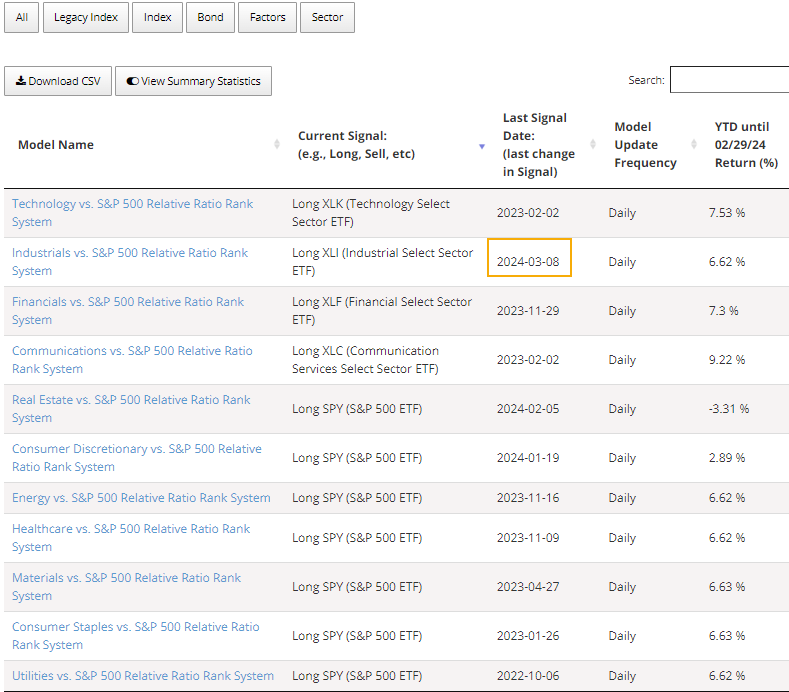
If you haven't had time to visit the website's Strategies page, I would encourage you to explore the expanded selections of index trading models for ETFs, which are now categorized. The following table provides a glimpse of the sector strategies, which use the same relative strength timing model as the one in today's note, albeit with slightly different parameters.
The cap-weighted Industrials ETF (XLI) generated a buy signal on March 8th, joining Technology, Financials, and Communication Services in the long bucket. When a sector is not on a buy signal, the model allocates to the S&P 500.
What the research tells us...
Industrial sector stocks are often seen as bellwethers for economic activity, reflecting demand for goods and services across various industries. When these stocks exhibit positive relative strength versus the broad market, it can suggest businesses are investing in capital goods, manufacturing is improving, and consumer demand may be growing. A trading model that captures this real-time market message triggered a new buy signal. Similar precedents suggest the sustainability of the uptrend in the S&P 500 looks compelling.