Products
SentimenTrader Trading Tools
‍
Backtest Engine
My Trading Toolkit
Correlation Analysis
Seasonality
Market Prediction
Indicators & Data API
‍
Proprietary Indicators & Charts
Market Data API
Strategies & Scanner
‍
50+ Trading Strategies
Smart Stock Scanner
Smart Option Scanner
Research Reports
‍
Research Solutions
Reports Library
Free Resources
Simple Backtest Calculator
Simple Seasonality Calculator
The Kelly Criterion Calculator
Sentiment Geo Map
Public Research Reports
Education
Sentiment Indicators
Technical Indicators
Pricing
Company
About
In the News
Testimonials
Client Success Stories
Contact
Log inLoginSign up
< BACK TO ALL REPORTS

A bullish shift in long-term uptrends

Dean Christians
2024-02-28
For only the 27th time since 1932, the percentage of S&P 500 stocks in a long-term uptrend cycled from below 20% to above 80%. Similar trend change shifts produced outstanding results for the world's most benchmarked index.

Key points:

  • The percentage of S&P 500 stocks with a medium-term average above a long-term average rose above 80%
  • Similar moving average trend conditions suggest a sustainable long-term uptrend for the S&P 500
  • Defensive sector stocks have exhibited the most significant positive shift towards uptrends

More and more stocks are shifting to long-term uptrends

Whether annual highs or long-term trend-following indicators, the internal health of the S&P 500 continues to improve, indicating a bullish backdrop for stocks.

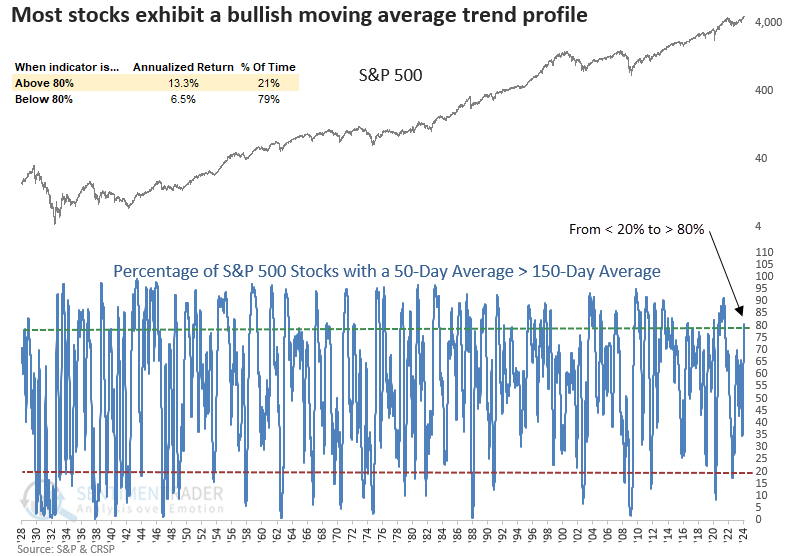
The latest indicator to flash an all-clear signal is the percentage of S&P 500 stocks with a 50-day average above their 150-day average. This long-term indication of stock participation cycled from below 20% to above 80% for the first time in over three years.

Readings exceeding 80% are associated with an annual return of 13.3% since 1928, twice the return observed when the indicator is below that threshold.

Similar long-term stock trend shifts led to bullish outcomes

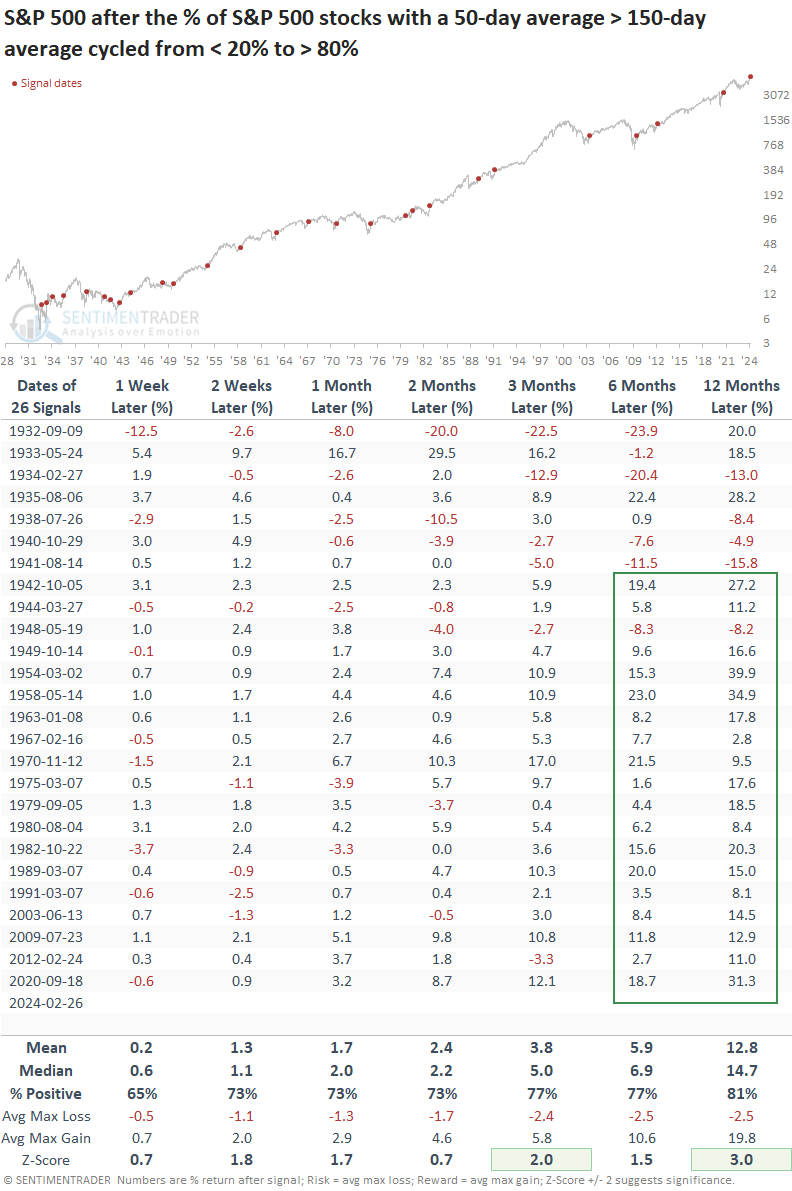
The S&P 500 has historically demonstrated exceptional performance when the percentage of stocks with a 50-day average above their 150-day average shifted from below 20% to above 80%. Consistency has been remarkable since 1942, with only one loss over the subsequent six and twelve-month periods.

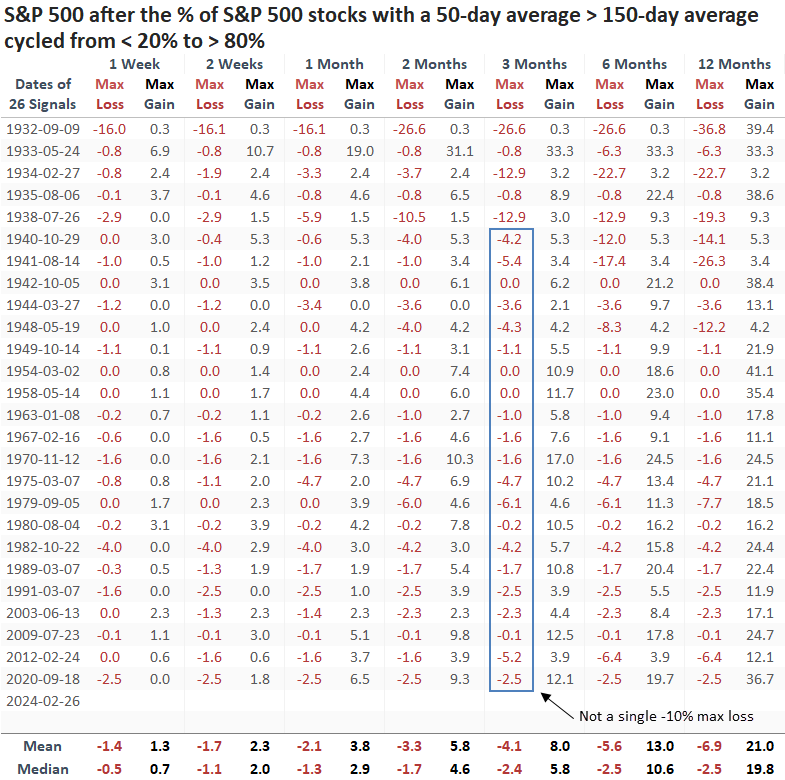
From 1938 onward, the S&P 500 has consistently avoided experiencing a maximum loss exceeding -10% in the subsequent three months, hinting at a potential low volatility uptrend for the world's most benchmarked index. 

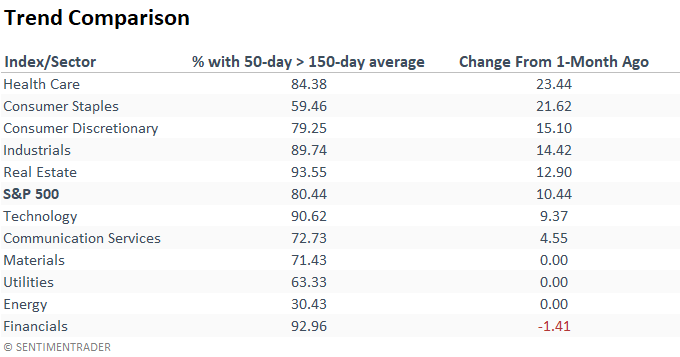
The improvement in uptrends has largely been driven by defensive sectors, which have been hindered by the FOMC interest rate hiking cycle. 

Healthcare, a group I highlighted in a recent research report, led the expansion in uptrends over the last month. 

What the research tells us...

For only the 27th time since 1932, the percentage of S&P 500 stocks in a long-term uptrend cycled from below 20% to above 80%. Following comparable signals, the world's most benchmarked index was higher 81% of the time a year later. Since 1942, the outcomes have been overwhelmingly positive, showing just one loss in the subsequent six and twelve-month periods. Defensive sectors led the bullish shift in trends, notably spearheaded by Healthcare.

PRODUCTS
SentimenTrader
Trading Tools
Indicators & Data API
‍
Strategies & Scanner
‍
Research Reports
FREE
RESOUrCES
Simple Backtest
Calculator
Simple Seasonality
Calculator
The Kelly Criterion
Calculator
Sentiment Geo Map
‍
Public Research Reports
‍
Education
Sentiment Indicators
‍
Technical Indicators
‍
Pricing
Bundle pricing
‍
FAQ
‍
Announcements
‍
COMPANY
‍
About
‍
In the News
‍
Testimonials
‍
Client Success Stories
CONTACT
‍
General Inquiries
‍
Media Inquiries
‍
Financial Professionals Inquiries
‍
© 2026 Sundial Capital Research Inc. All rights reserved.
Setsail Marketing
TermsPrivacyAffiliate Program
Risk Disclosure: The information and tools provided are for research and analytical purposes only and are not intended as investment advice. Market analysis involves uncertainty, and outcomes may differ from expectations. Users should conduct their own due diligence and consider their individual circumstances before making any financial decisions. Past performance is not necessarily indicative of future results.

Hypothetical Performance Disclosure: Hypothetical performance results have many inherent limitations, some of which are described below. No representation is being made that any account will or is likely to achieve profits or losses similar to those shown; in fact, there are frequently sharp differences between hypothetical performance results and the actual results subsequently achieved by any particular trading program. One of the limitations of hypothetical performance results is that they are generally prepared with the benefit of hindsight. In addition, hypothetical trading does not involve financial risk, and no hypothetical trading record can completely account for the impact of financial risk of actual trading. for example, the ability to withstand losses or to adhere to a particular trading program in spite of trading losses are material points which can also adversely affect actual trading results. There are numerous other factors related to the markets in general or to the implementation of any specific trading program which cannot be fully accounted for in the preparation of hypothetical performance results and all which can adversely affect trading results.

Testimonial Disclosure: Testimonials appearing on this website may not be representative of other clients or customers and is not a guarantee of future performance or success.