Products
SentimenTrader Trading Tools
‍
Backtest Engine
My Trading Toolkit
Correlation Analysis
Seasonality
Market Prediction
Indicators & Data API
‍
Proprietary Indicators & Charts
Market Data API
Strategies & Scanner
‍
50+ Trading Strategies
Smart Stock Scanner
Smart Option Scanner
Research Reports
‍
Research Solutions
Reports Library
Free Resources
Simple Backtest Calculator
Simple Seasonality Calculator
The Kelly Criterion Calculator
Sentiment Geo Map
Public Research Reports
Education
Sentiment Indicators
Technical Indicators
Pricing
Company
About
In the News
Testimonials
Client Success Stories
Contact
Log inLoginSign up
< BACK TO ALL REPORTS

A bullish reversal pattern for the S&P 500

Dean Christians
2022-10-25
A price-based reversal pattern for the S&P 500 triggered a new buy signal on Monday. After similar reversals, the S&P 500 saw further upside in the near term.

Key points:

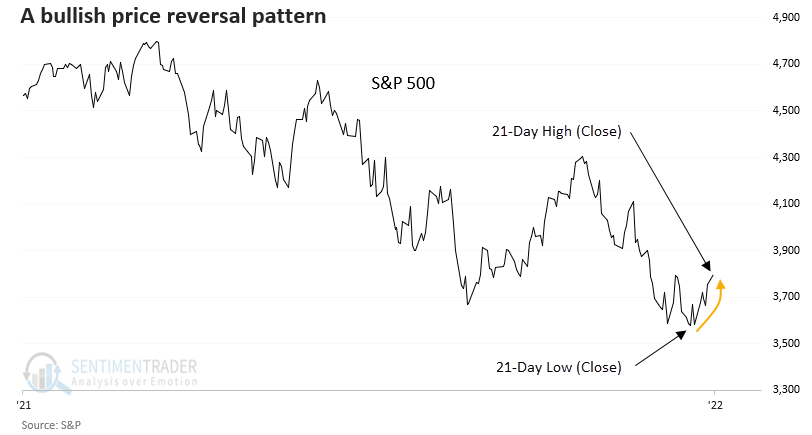
  • The S&P 500 reversed from a 21-day low (close) to a 21-day high (close)
  • The low-to-high price reversal occurred in fewer than ten sessions 
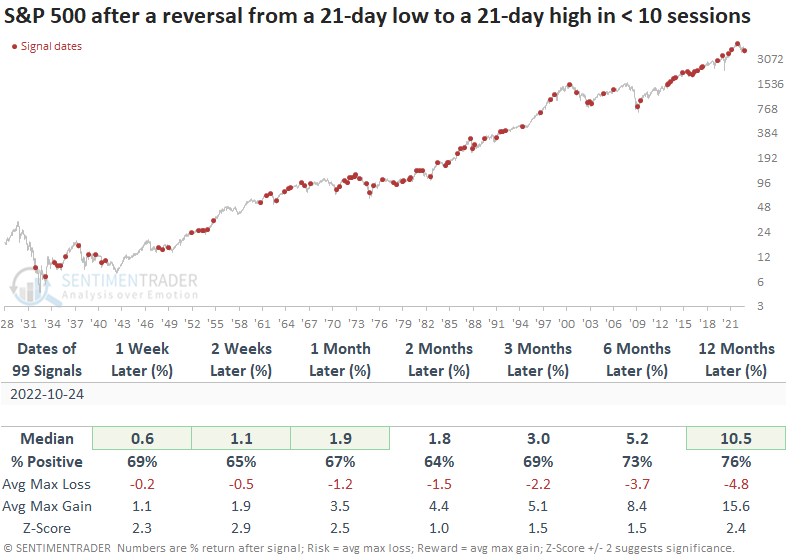
  • After similar price reversals, the S&P 500 tended to see further upside in the near term

A price reversal pattern with bullish implications for the S&P 500

The stock market continues to rally from an oversold condition. While market breadth has been constructive in a handful of sessions, we have yet to see an urgency on the part of buyers that generally triggers breadth thrust buy signals. 

Sometimes, breadth-based indicators fail to give us the all-clear signal. So, we monitor price-based patterns for bullish reversals.

The world's most-watched benchmark reversed from a 21-day low (close) to a 21-day high (close) in fewer than ten sessions, triggering a bullish price-based pattern. 

Similar reversal patterns preceded positive returns

A swift reversal from a 21-day low (close) to a 21-day high (close) typically leads to more upside momentum, especially in the near term. After the initial bounce in the first month, the S&P 500 tends to consolidate the gains before heading higher. 

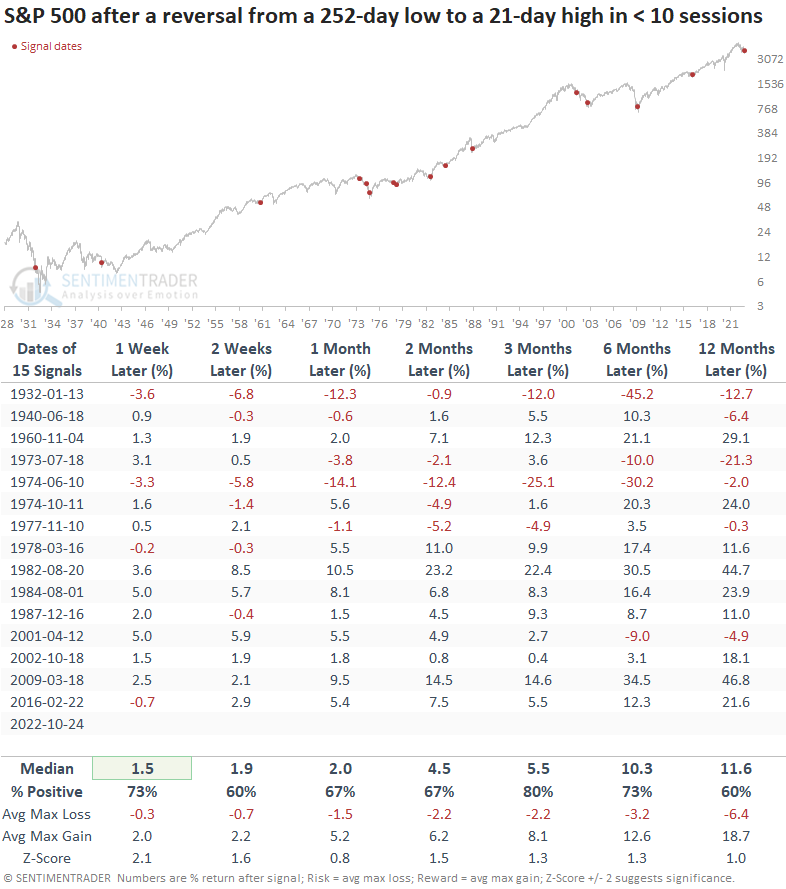
The price reversal pattern typically occurs during bull markets. So, let's add some context to the signal. I will now identify a reversal from a 252-day low (close) to a 21-day high (close) in fewer than ten sessions, which should capture alerts in significant drawdown phases like now.

While returns and win rates still look impressive, we see a slight deterioration in the z-scores across most time frames. A signal occurred after significant bottoms in 1974, 1982, 2002, and 2009. However, the pattern was also susceptible to a whipsaw alert in some of those same drawdown phases.

What the research tells us...

Stock market indexes are rallying from an oversold condition. The counter-trend bounce has failed to trigger breadth-based thrust signals similar to the June to August rebound. However, a price-based reversal pattern for the S&P 500 issued a new alert on Monday. After similar reversals, the S&P 500 tended to see further upside in the near term, regardless of the environment.

PRODUCTS
SentimenTrader
Trading Tools
Indicators & Data API
‍
Strategies & Scanner
‍
Research Reports
FREE
RESOUrCES
Simple Backtest
Calculator
Simple Seasonality
Calculator
The Kelly Criterion
Calculator
Sentiment Geo Map
‍
Public Research Reports
‍
Education
Sentiment Indicators
‍
Technical Indicators
‍
Pricing
Bundle pricing
‍
FAQ
‍
Announcements
‍
COMPANY
‍
About
‍
In the News
‍
Testimonials
‍
Client Success Stories
CONTACT
‍
General Inquiries
‍
Media Inquiries
‍
Financial Professionals Inquiries
‍
© 2026 Sundial Capital Research Inc. All rights reserved.
Setsail Marketing
TermsPrivacyAffiliate Program
Risk Disclosure: The information and tools provided are for research and analytical purposes only and are not intended as investment advice. Market analysis involves uncertainty, and outcomes may differ from expectations. Users should conduct their own due diligence and consider their individual circumstances before making any financial decisions. Past performance is not necessarily indicative of future results.

Hypothetical Performance Disclosure: Hypothetical performance results have many inherent limitations, some of which are described below. No representation is being made that any account will or is likely to achieve profits or losses similar to those shown; in fact, there are frequently sharp differences between hypothetical performance results and the actual results subsequently achieved by any particular trading program. One of the limitations of hypothetical performance results is that they are generally prepared with the benefit of hindsight. In addition, hypothetical trading does not involve financial risk, and no hypothetical trading record can completely account for the impact of financial risk of actual trading. for example, the ability to withstand losses or to adhere to a particular trading program in spite of trading losses are material points which can also adversely affect actual trading results. There are numerous other factors related to the markets in general or to the implementation of any specific trading program which cannot be fully accounted for in the preparation of hypothetical performance results and all which can adversely affect trading results.

Testimonial Disclosure: Testimonials appearing on this website may not be representative of other clients or customers and is not a guarantee of future performance or success.