Products
SentimenTrader Trading Tools
‍
Backtest Engine
My Trading Toolkit
Correlation Analysis
Seasonality
Market Prediction
Indicators & Data API
‍
Proprietary Indicators & Charts
Market Data API
Strategies & Scanner
‍
50+ Trading Strategies
Smart Stock Scanner
Smart Option Scanner
Research Reports
‍
Research Solutions
Reports Library
Free Resources
Simple Backtest Calculator
Simple Seasonality Calculator
The Kelly Criterion Calculator
Sentiment Geo Map
Public Research Reports
Education
Sentiment Indicators
Technical Indicators
Pricing
Company
About
In the News
Testimonials
Client Success Stories
Contact
Log inLoginSign up
< BACK TO ALL REPORTS

A bullish reversal from an oversold condition

Dean Christians
2023-08-30
The percentage of oversold stocks cycled from greater than 65% to less than 20% in seven sessions, with the S&P 500 above its 200-day average. Similar oversold reversals led to higher prices for the S&P 500 over the subsequent two months.

Key points:

  • The percentage of oversold stocks cycled from greater than 65% to less than 20% in seven sessions
  • Similar oversold reversals in an uptrend led to mostly higher stock prices over the next two months

Should we buy the dip?

The recent pullback in the S&P 500 appears to be a routine correction, with the index falling almost 6% on a peak-to-trough basis. Shallow drawdowns are typically associated with oversold conditions from short-duration breadth-based indicators. Long-duration measures tend to hold up, as I highlighted in my note titled, a bullish increase in new lows. 

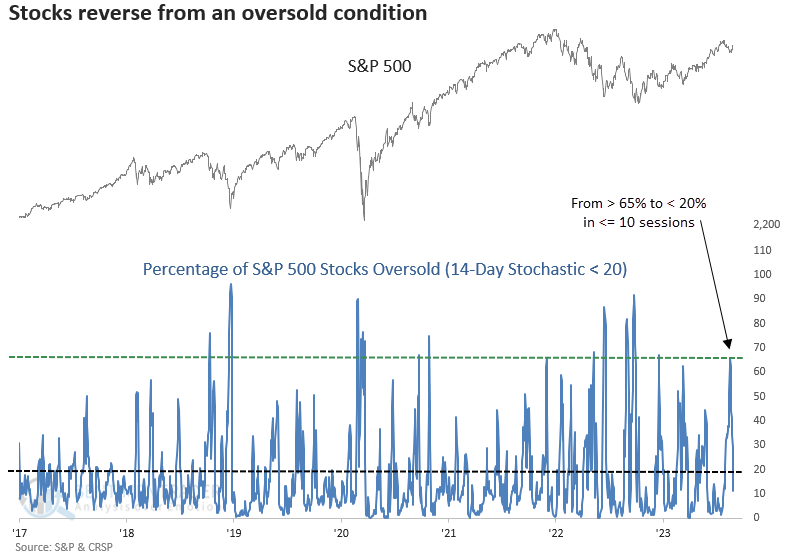
One short-duration indicator that reached a washed-out status is the percentage of oversold stocks. This breadth-based time series measures how many issues have fallen below a reading of 20% using a 14-day stochastic. 

The percentage of oversold stocks in the S&P 500 rose above 65% on 2023-08-18. Subsequently, it reversed below 20% in ten or fewer sessions, triggering a bullish reversal signal within an uptrend.

Similar oversold reversals in an uptrend led to positive returns

When the percentage of oversold S&P 500 stocks (14-day stochastic) cycles from greater than 65% to less than 20% in ten or fewer sessions with the S&P 500 above its 200-day average, the world's most benchmarked index tends to reestablish its uptrend. Over the next two months, the S&P 500 was higher at some point in 39 out of 41 precedents. 

If I include a sell condition to the study that exits the S&P 500 when the index closed at a 20-day high or low, whichever occurred first, the S&P 500 closed at the 20-day high 80% of the time. So, the odds favor a new year-to-date high for the S&P 500.

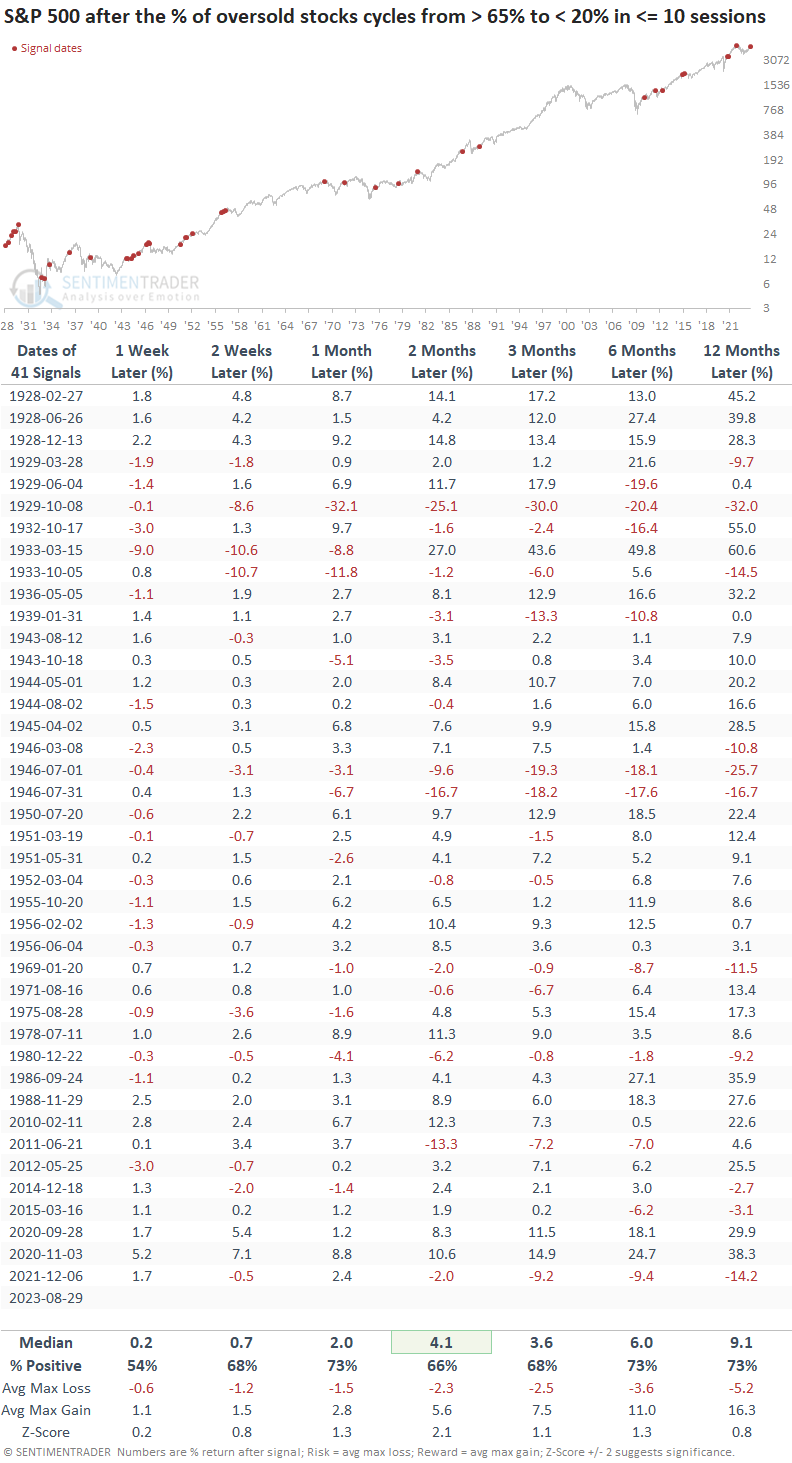
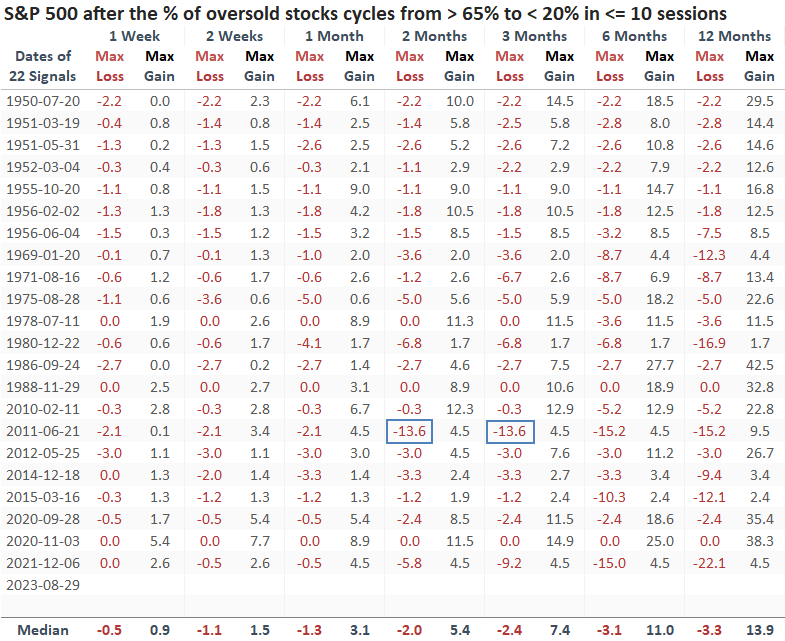
The danger associated with buying oversold conditions is that the alleviation of selling pressure might manifest as a short-lived relief rally that eventually proves unsuccessful, causing stocks to record even lower lows. Considering that just five precedents display a maximum loss exceeding -10%, the likelihood of a substantial drop from this point seems minimal. 
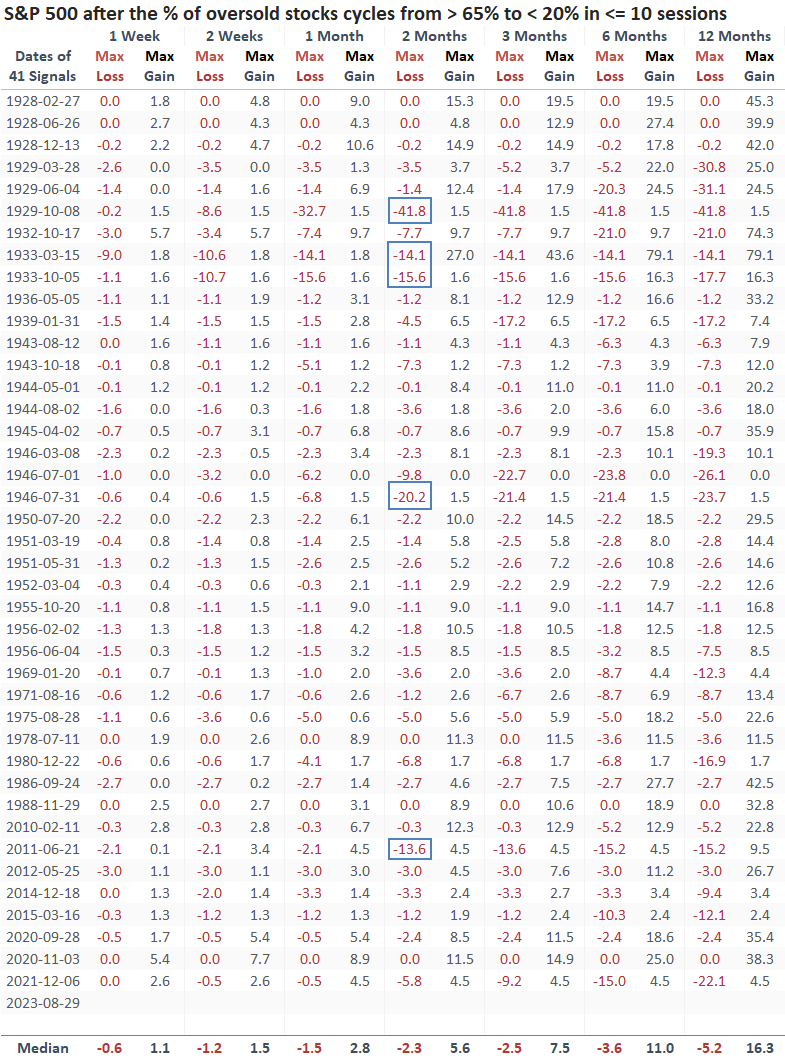
Results since 1950

Suppose we examine precedents after the 1929-42 secular bear market. In that case, the results are more favorable. Over the next two months, the S&P 500 was higher at some point in all but one case. 

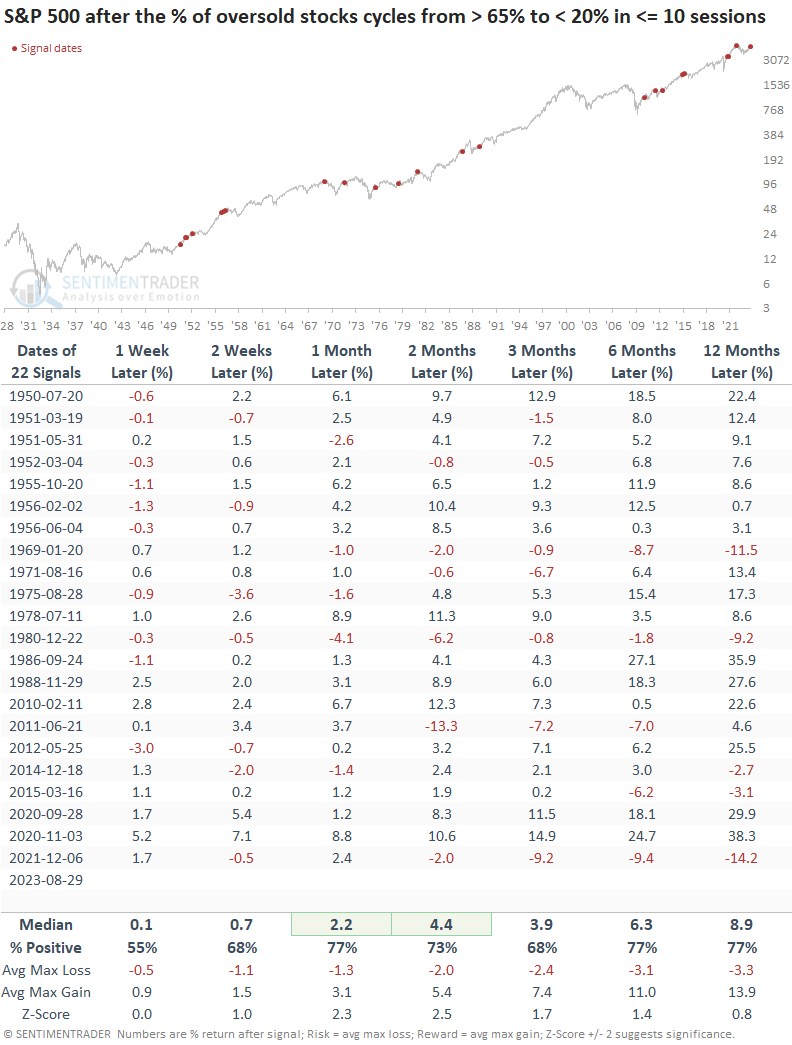
Since 1950, only one precedent resulted in a max loss of greater than -10% over the subsequent two and three-month time horizons. 

What the research tells us...

The S&P 500 and other indexes have experienced a second drawdown phase in 2023, causing multiple short-duration breadth indicators to reach levels commonly associated with a standard bull market correction. On such indicator, the percentage of oversold stocks rose above 65% and subsequently reversed below 20% in fewer than ten sessions. After similar signals, the S&P 500 demonstrated a tendency to restore its uptrend. This was especially pronounced starting in 1950. 

PRODUCTS
SentimenTrader
Trading Tools
Indicators & Data API
‍
Strategies & Scanner
‍
Research Reports
FREE
RESOUrCES
Simple Backtest
Calculator
Simple Seasonality
Calculator
The Kelly Criterion
Calculator
Sentiment Geo Map
‍
Public Research Reports
‍
Education
Sentiment Indicators
‍
Technical Indicators
‍
Pricing
Bundle pricing
‍
FAQ
‍
Announcements
‍
COMPANY
‍
About
‍
In the News
‍
Testimonials
‍
Client Success Stories
CONTACT
‍
General Inquiries
‍
Media Inquiries
‍
Financial Professionals Inquiries
‍
© 2026 Sundial Capital Research Inc. All rights reserved.
Setsail Marketing
TermsPrivacyAffiliate Program
Risk Disclosure: The information and tools provided are for research and analytical purposes only and are not intended as investment advice. Market analysis involves uncertainty, and outcomes may differ from expectations. Users should conduct their own due diligence and consider their individual circumstances before making any financial decisions. Past performance is not necessarily indicative of future results.

Hypothetical Performance Disclosure: Hypothetical performance results have many inherent limitations, some of which are described below. No representation is being made that any account will or is likely to achieve profits or losses similar to those shown; in fact, there are frequently sharp differences between hypothetical performance results and the actual results subsequently achieved by any particular trading program. One of the limitations of hypothetical performance results is that they are generally prepared with the benefit of hindsight. In addition, hypothetical trading does not involve financial risk, and no hypothetical trading record can completely account for the impact of financial risk of actual trading. for example, the ability to withstand losses or to adhere to a particular trading program in spite of trading losses are material points which can also adversely affect actual trading results. There are numerous other factors related to the markets in general or to the implementation of any specific trading program which cannot be fully accounted for in the preparation of hypothetical performance results and all which can adversely affect trading results.

Testimonial Disclosure: Testimonials appearing on this website may not be representative of other clients or customers and is not a guarantee of future performance or success.