
A bullish relative strength message from Industrial stocks

Key points:
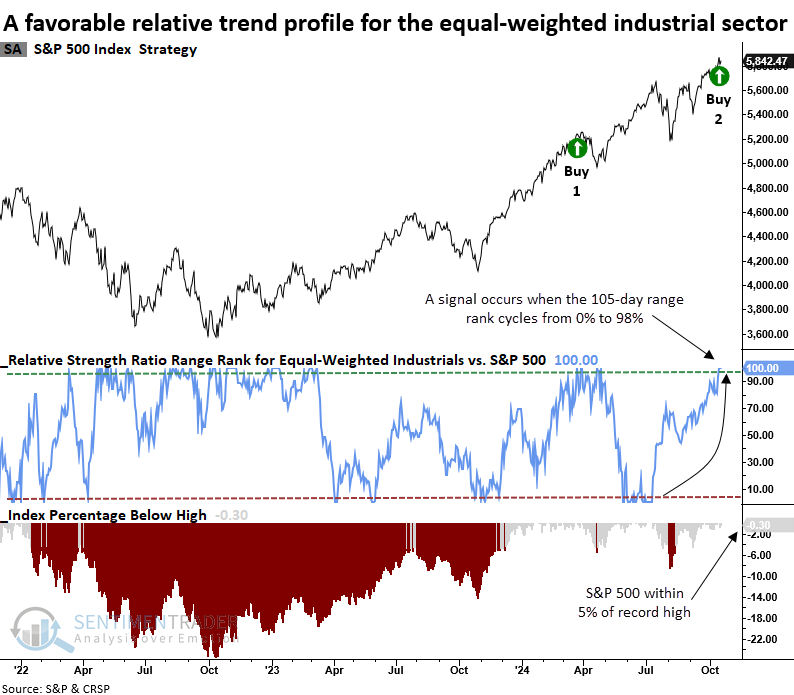
- The equal-weighted S&P 500 Industrials sector triggered a range rank buy signal
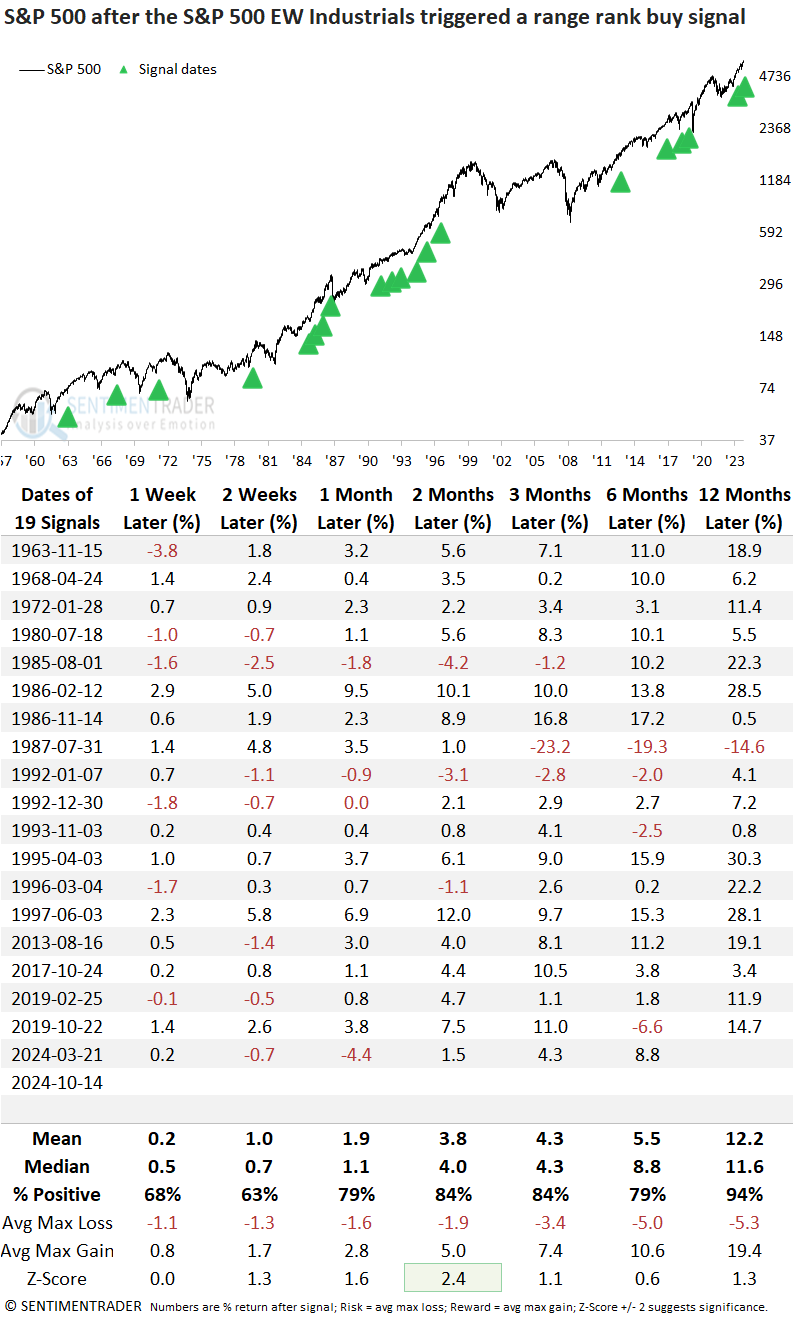
- Comparable signals near a high saw the S&P 500 rise 94% of the time over the subsequent year
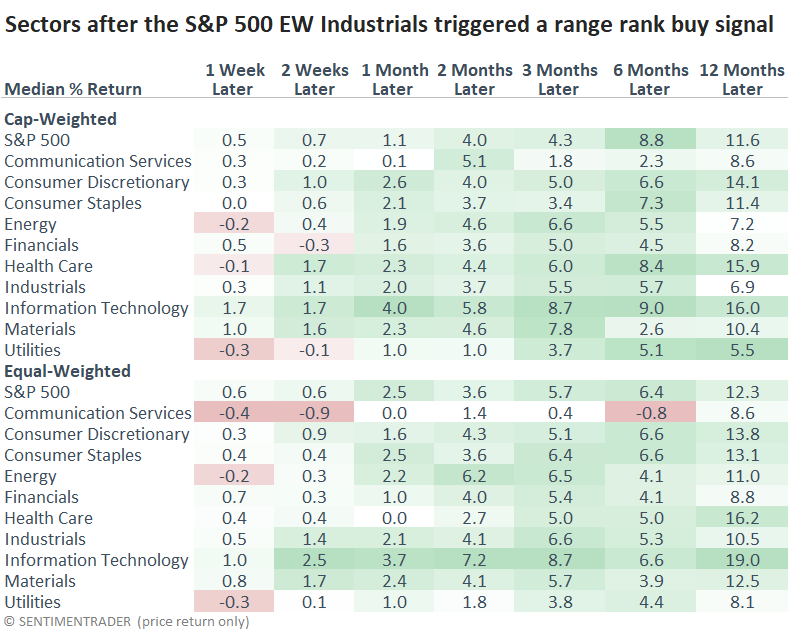
- Equal-weighted indexes showed a slight tendency to outperform cap-weighted ones
A bullish market message from the industrial sector
Over the last week, members in the discretionary, financial, and industrial sectors have surged to 52-week highs, indicating broad participation from economically sensitive stocks. While breadth-based indicators like new highs are an excellent tool for gauging trends, relative strength analysis offers a complementary perspective on market dynamics. For this reason, several components in the TCTM Composite Confirmation Model monitor relative trends for critical groups.
One of those measures compares the S&P 500 equal-weighted industrial sector to the S&P 500. The equal-weighted industrials sector delivered a compelling market message after testing cap and equal-weighted sectors for a bearish to bullish transition to confirm a new uptrend in the broad market. Although the original intent was to identify an early cycle message, the signal works equally well in established uptrends.
For the second time in 2024, a relative strength timing system triggered a buy signal for the S&P 500 equal-weighted industrials sector, with the broad market trading near a record high. The previous alert from March saw the S&P 500 gain 8% over six months.
Comparable relative strength signals preceded outstanding returns for the broad market
Whenever the equal-weighted Industrials sector generated a range rank buy signal while the S&P 500 closed within 5% of a record high, the world's most benchmarked index consistently delivered exceptional returns. This trend was especially pronounced a year later, with the index rising in every case but one.
Even over shorter time frames, such as three months, the signal showed remarkable reliability, with the index climbing in 10 consecutive occurrences since 1992. Furthermore, the winning steak since 1992 occurred during a growth stock-dominated era. Yet, the value/cyclical signal still proved prescient for the broad market.
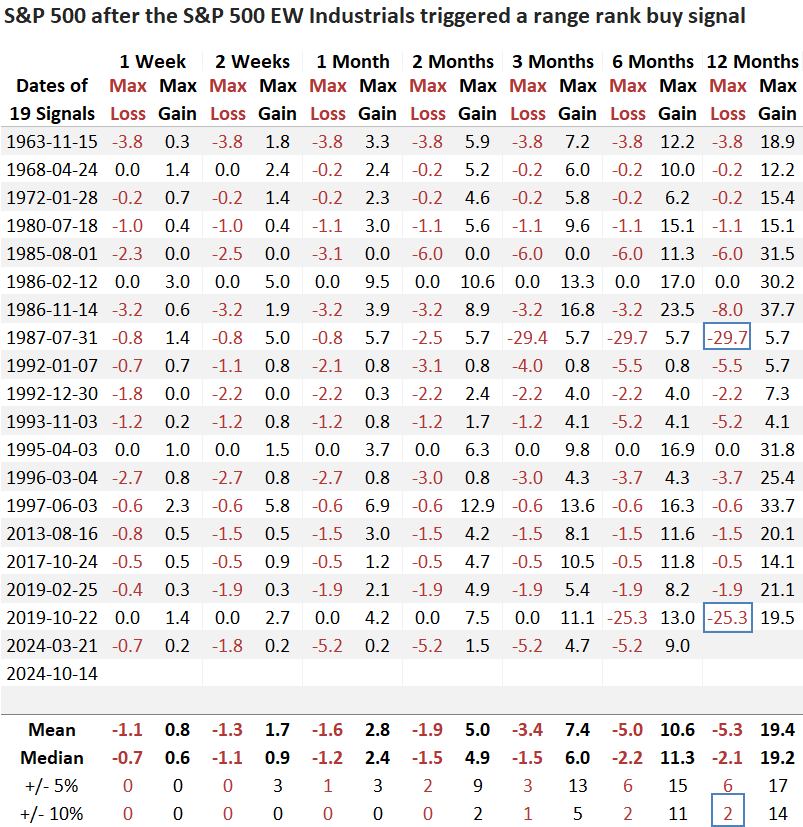
Over the subsequent year, the S&P 500 experienced just two instances of a maximum loss exceeding 10%, both associated with rare, crash-related market events.
Neither the cap-weighted nor equal-weighted industrials sector outperformed the S&P 500 over the following six or twelve months. In line with other recent studies, growth-oriented sectors such as consumer discretionary, healthcare, and technology surpassed the broader market. Additionally, the equal-weighted indexes generally outperformed their cap-weighted counterparts by a modest margin.
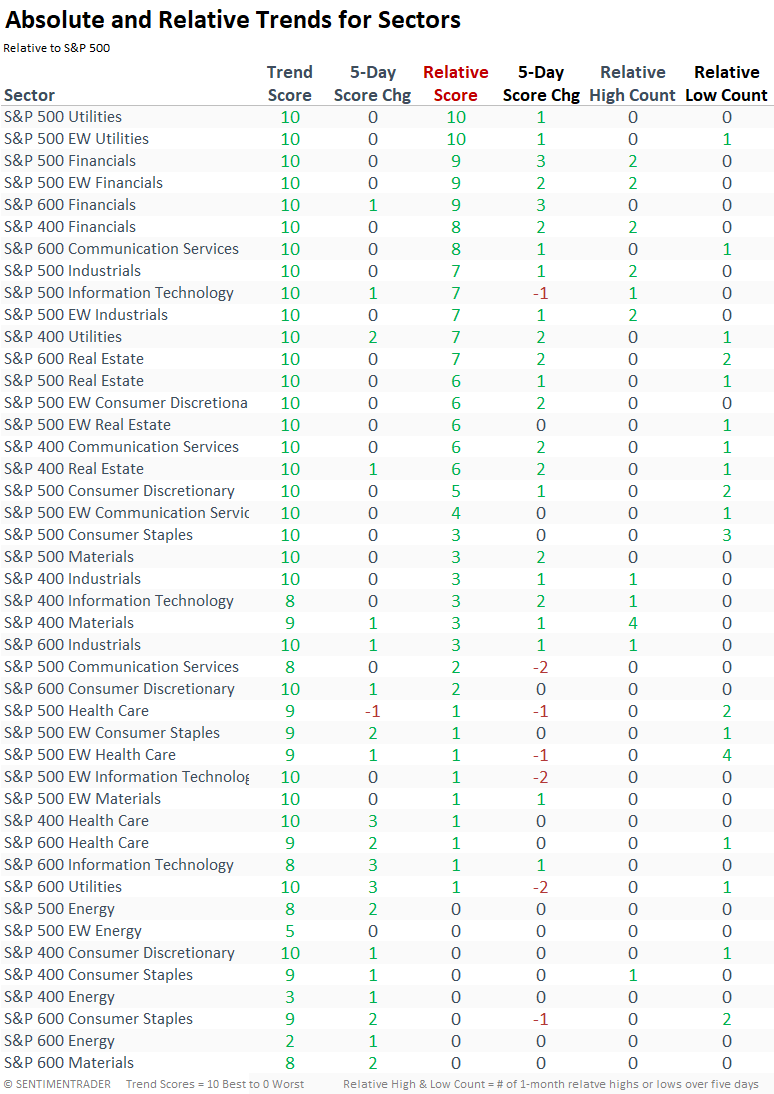
Relative strength
The share of sectors across large, mid, and small-cap stocks with a positive relative trend score continues to rise, signaling a widening range of investment opportunities. This contrasts with earlier this year when large-cap technology and communications dominated the landscape.
What the research tells us...
Although the U.S. has shifted from an industrial-based economy to a more consumer-oriented one, the market message from the industrial sector is a critical factor to monitor. When industrials outperform, it reflects a broader demand for goods and services that drive economic expansion. This strength has typically served as a leading indicator of a risk-on market environment. Following similar relative trend signals from industrials near a high, the S&P 500 rose 94% of the time over the subsequent year.