
A bullish recovery for the Macro Index Model

Key points:
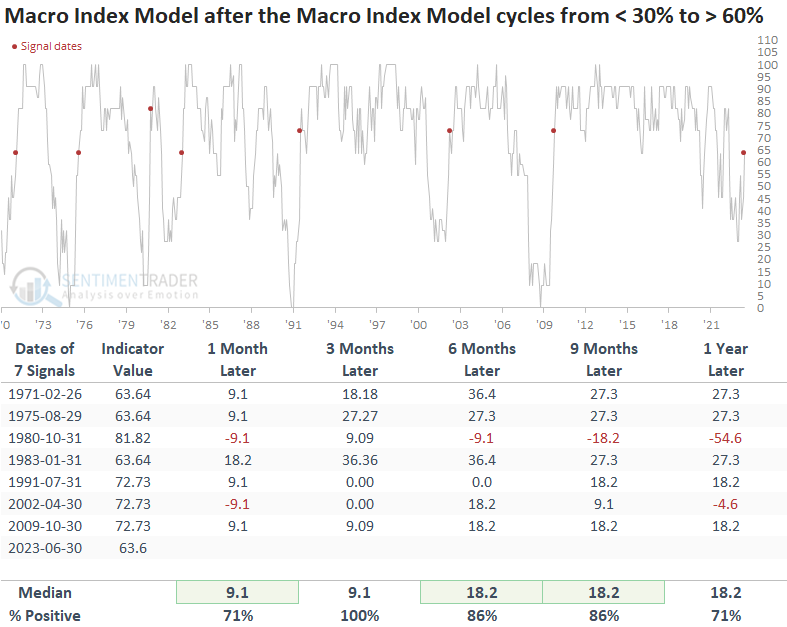
- The Macro Index Model cycled from less than 30% to greater than 60%
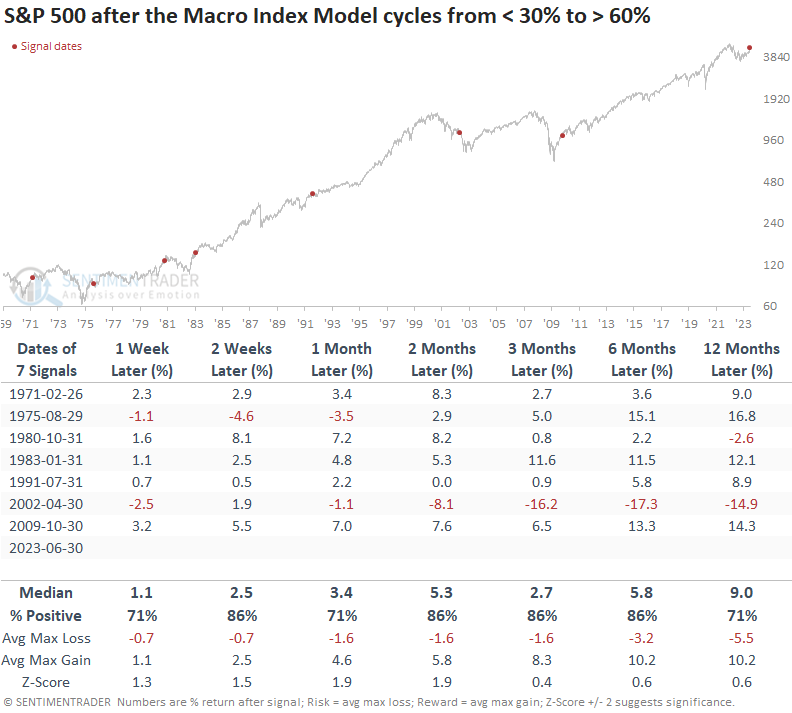
- After similar recoveries, the S&P 500 was higher 86% of the time over the next six months
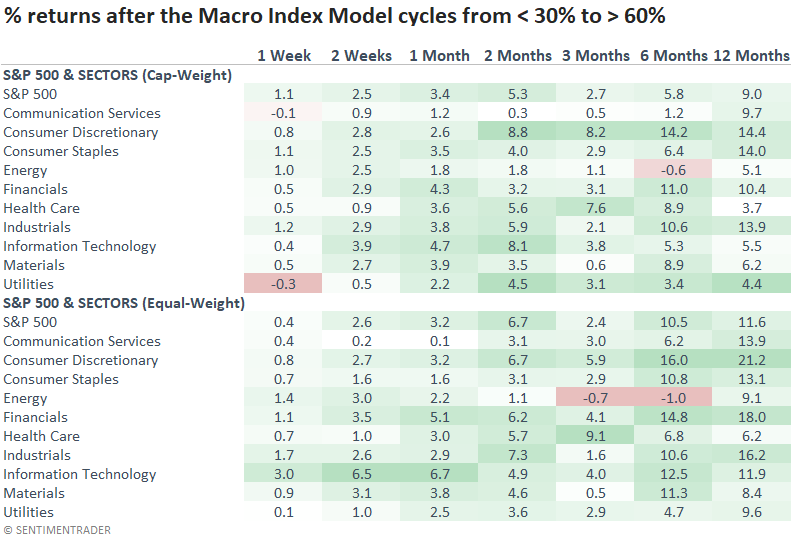
- Cyclical sectors generally outperform defensive ones, and equal-weighted indexes surpass cap-weighted versions
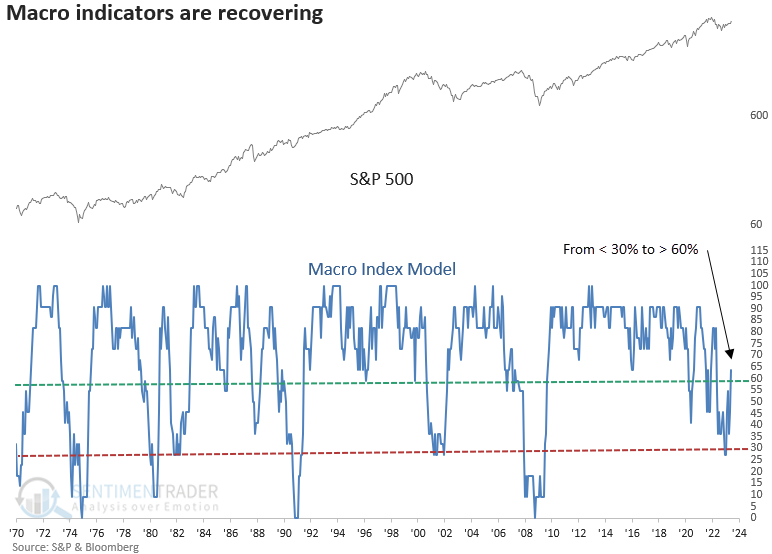
More and more macroeconomic indicators are turning bullish
In February, the Macro Index Model, a composite consisting of 11 diverse economic indicators, experienced an unprecedented surge, with one of history's most significant month-over-month increases. The substantial jump marked a pivotal moment, as the composite has maintained an upward trajectory over the past five months.
After the latest update last week, the composite has now swung from under 30% to over 60%. Let's assess the outlook for stocks after similar shifts.
A recovery in the Macro Index Model preceded positive returns
When the Macro Index Model cycles from below 30% to above 60%, the S&P 500 tends to rally, benefiting from the positive economic conditions that serve as a tailwind for the market.
As with most macroeconomic signals, the sample size is small.
From a sector perspective, Consumer Discretionary, Financials, and Industrials tend to outperform. Opting for cyclical groups over defensive ones should be favored, and ETF investors might find equal-weighted indexes to be a more suitable alternative to cap-weighted indexes.
Stocks like bullish economic conditions
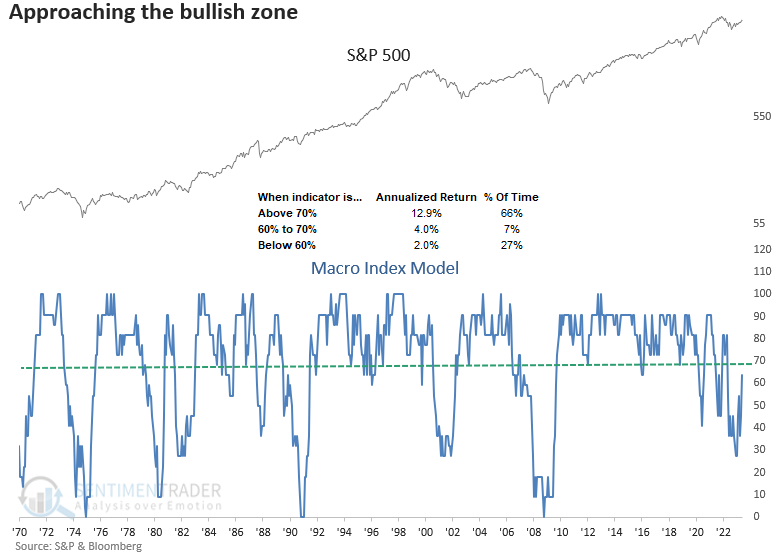
With 7 out of 11 components positive, the Macro Index Model is on the brink of entering the bullish zone. By adding one more member to the positive side of the ledger, the model would cross the significant 70% threshold, known for delivering annualized returns greater than 12% for the S&P 500.
When the Macro Index Model cycles from less than 30% to greater than 60%, the model has moved higher at some point over the next six months every time.
What the research tells us...
The Macro Index Model, a diverse composite of economic indicators, cycled from less than 30% to greater than 60%. Similar reversals led to a bullish outlook for the S&P 500 over the next six months in all but one case. From a portfolio allocation standpoint, cyclical groups provide better opportunities. And ETF investors might consider an equal-weighted index over a cap-weighted one. Whenever the Macro Index Model has reversed in a similar manner to the present situation, it has shown a tendency to rise even higher. Therefore, the chances of entering the bullish 70% zone appear promising.