Products
SentimenTrader Trading Tools
‍
Backtest Engine
My Trading Toolkit
Correlation Analysis
Seasonality
Market Prediction
Indicators & Data API
‍
Proprietary Indicators & Charts
Market Data API
Strategies & Scanner
‍
50+ Trading Strategies
Smart Stock Scanner
Smart Option Scanner
Research Reports
‍
Research Solutions
Reports Library
Free Resources
Simple Backtest Calculator
Simple Seasonality Calculator
The Kelly Criterion Calculator
Sentiment Geo Map
Public Research Reports
Education
Sentiment Indicators
Technical Indicators
Pricing
Company
About
In the News
Testimonials
Client Success Stories
Contact
Log inLoginSign up
< BACK TO ALL REPORTS

A bullish policy shift in Brazil

Dean Christians
2023-08-11
The central bank for Brazil cut its target rate for the first time after a tightening cycle, triggering a bullish backdrop for the Ibovespa Index. Similar shifts in monetary policy led to gains 86% of the time for the Brazilian benchmark over the next three and six months.

Key points:

  • The Brazilian Central Bank lowered its target rate for the first time after a tightening cycle
  • Similar shifts in policy led to an 86% win rate for the Ibovespa Index over the next three and six months
  • Returns for the Brazil ETF (EWZ) tend to exceed those of the S&P 500 over the next six and twelve months

Brazil pivots from its restrictive monetary policy stance

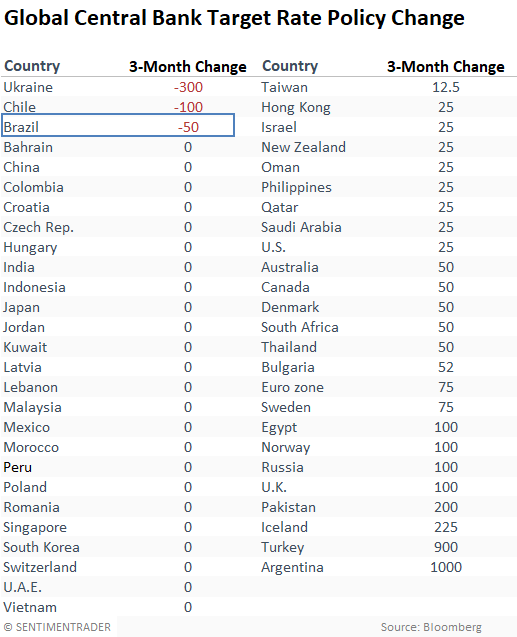
The Brazilian central bank cut its target rate on August 2nd, marking the third country to shift its monetary policy stance from tightening to easing. The accompanying statement emphasized the role of an improved consumer inflation outlook as a driver for the policy change. 

Transitions from tightening to easing monetary policy typically generate a favorable response from stocks. When stocks respond negatively, the central bank's actions often come too late, with the economy already reeling from the repercussions of the tightening cycle. 

Inflation, central bank policy, and stock returns

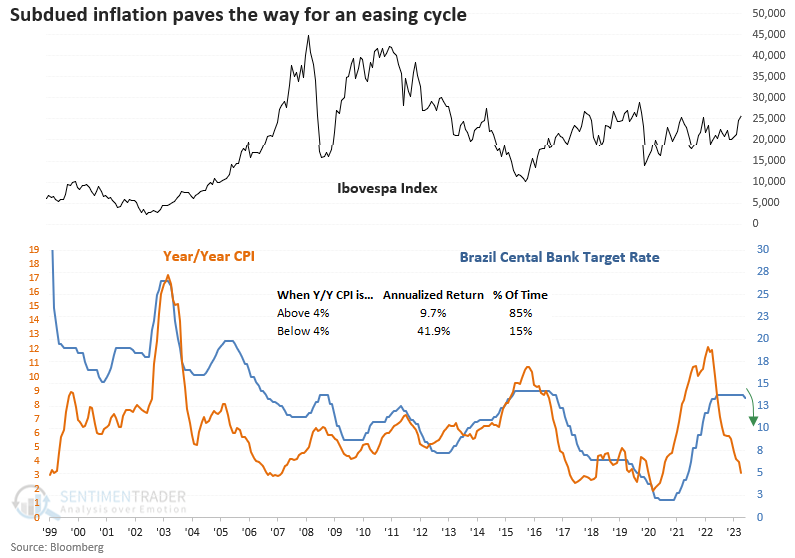
Brazil's year-over-year Consumer Price Index dropped to 3%, a threshold reached in just 9% of months since 1999. Annualized returns of 42% are observed for the Ibovespa Index when CPI falls below 4%.

Similar shifts from tightening to easing led to positive returns for the Ibovespa Index

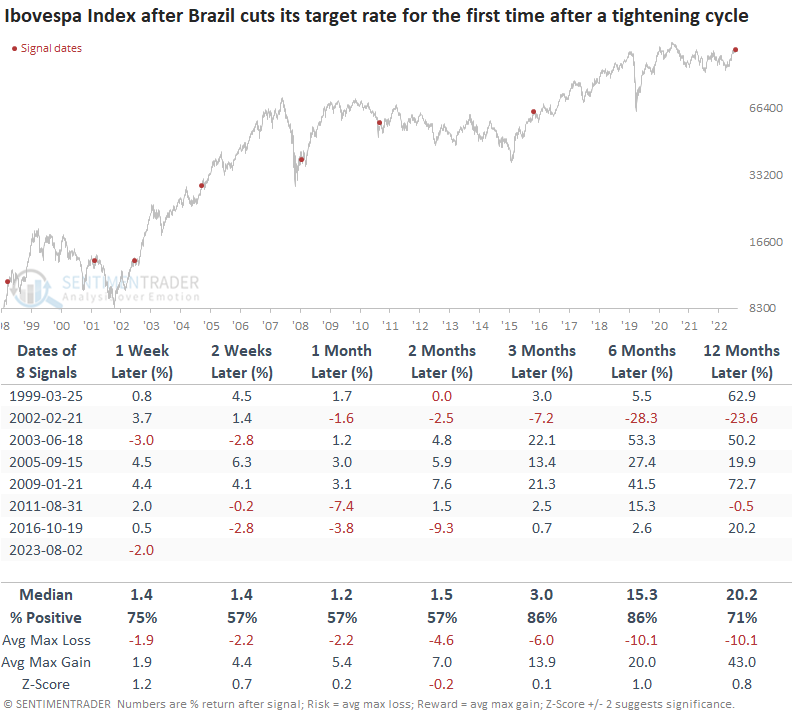
While the sample size is small, the first rate cut after a tightening cycle tends to be bullish for the Ibovespa Index, with an 86% win rate over the next three and six months. 

The one outlier in 2002 occurred after Brazil's central bank raised rates in 2001, swimming against the tide of other banks around the globe who were easing policy. 

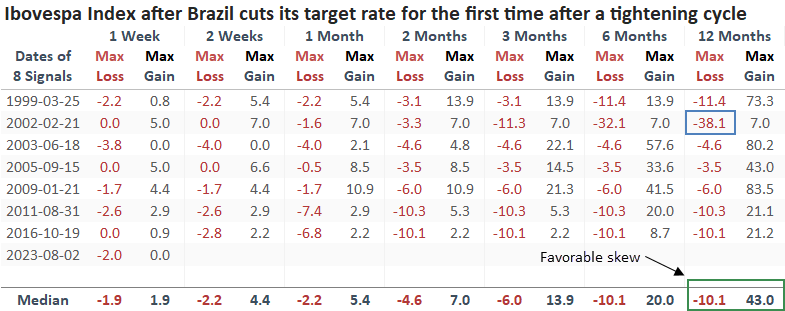
Except for 2002, the maximum gain exceeded the maximum loss by a significant amount over the next year. 

Relative comparison between the Brazil ETF (EWZ) and the S&P 500 ETF (SPY)

USD-based investors have limited options for accessing Brazilian stocks. One potential vehicle is the ETF (EWZ). While win rates are less favorable when compared to the Ibovespa Index, returns are better across most time frames.

When benchmarked against the S&P 500, the win rate resembles a coin toss in most cases. However, returns show potential for relative outperformance.

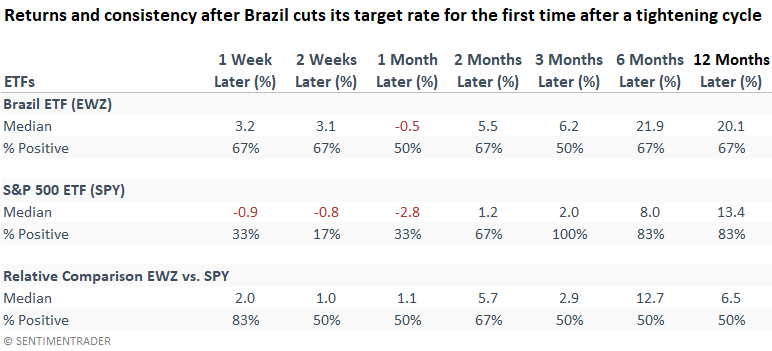
Due to data limitations, the EWZ comparison contains one less signal.

Trust but verify with other indicators 

Even though historical returns offer a glimpse into potential opportunities, allocating capital based on additional confirmation from other conditions or indicators is a more prudent approach.

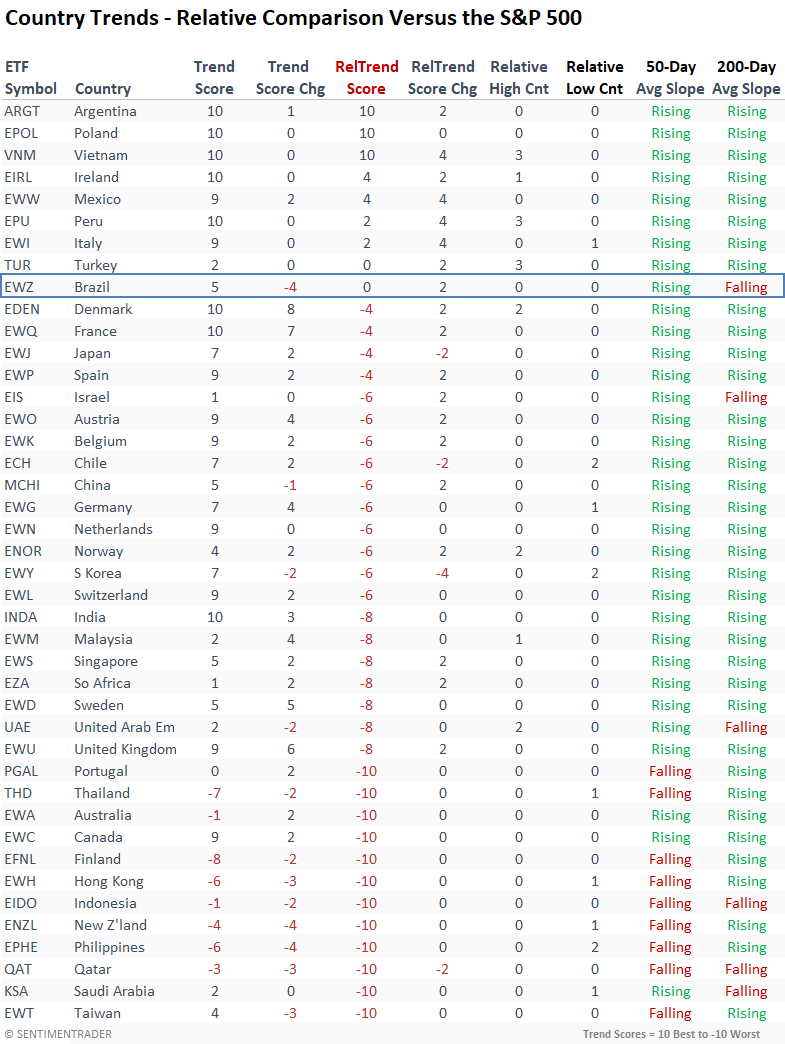
Although the EWZ ETF looks favorable compared to other country ETFs, its relative trend score does not reflect a bullish status when gauged against the S&P 500. And it's one of a handful of ETFs with a downward sloping 200-day average, an adverse long-term trend condition.

What the research tells us...

The Brazilian central bank reduced its target rate for the first time after raising rates 12 times, starting in March 2021. Historically, a shift in monetary policy, like now, has been a bullish development for the Ibovespa Index. USD-based investors can allocate capital to an ETF like EWZ. However, I would wait for absolute and relative trends to improve. 

PRODUCTS
SentimenTrader
Trading Tools
Indicators & Data API
‍
Strategies & Scanner
‍
Research Reports
FREE
RESOUrCES
Simple Backtest
Calculator
Simple Seasonality
Calculator
The Kelly Criterion
Calculator
Sentiment Geo Map
‍
Public Research Reports
‍
Education
Sentiment Indicators
‍
Technical Indicators
‍
Pricing
Bundle pricing
‍
FAQ
‍
Announcements
‍
COMPANY
‍
About
‍
In the News
‍
Testimonials
‍
Client Success Stories
CONTACT
‍
General Inquiries
‍
Media Inquiries
‍
Financial Professionals Inquiries
‍
© 2026 Sundial Capital Research Inc. All rights reserved.
Setsail Marketing
TermsPrivacyAffiliate Program
Risk Disclosure: The information and tools provided are for research and analytical purposes only and are not intended as investment advice. Market analysis involves uncertainty, and outcomes may differ from expectations. Users should conduct their own due diligence and consider their individual circumstances before making any financial decisions. Past performance is not necessarily indicative of future results.

Hypothetical Performance Disclosure: Hypothetical performance results have many inherent limitations, some of which are described below. No representation is being made that any account will or is likely to achieve profits or losses similar to those shown; in fact, there are frequently sharp differences between hypothetical performance results and the actual results subsequently achieved by any particular trading program. One of the limitations of hypothetical performance results is that they are generally prepared with the benefit of hindsight. In addition, hypothetical trading does not involve financial risk, and no hypothetical trading record can completely account for the impact of financial risk of actual trading. for example, the ability to withstand losses or to adhere to a particular trading program in spite of trading losses are material points which can also adversely affect actual trading results. There are numerous other factors related to the markets in general or to the implementation of any specific trading program which cannot be fully accounted for in the preparation of hypothetical performance results and all which can adversely affect trading results.

Testimonial Disclosure: Testimonials appearing on this website may not be representative of other clients or customers and is not a guarantee of future performance or success.