
A bullish overbought condition in Financials

Key points:
- More than 87% of S&P 500 Financial sector stocks reached an overbought condition, with the index at a high
- Similar overbought scenarios produced an 87% win rate for Financials over the subsequent six months
- The sector outperformed the S&P 500 over several time horizons during the favorable six-month period
Financials are surging higher, creating an overbought condition
Last week, I highlighted a breadth thrust signal for the S&P 500 Financials, which showed the sector rising 88% of the time over the next six months. After a two-day pause, upside momentum has reasserted itself again, resulting in a significant proportion of stocks reaching an overbought status.
To measure an overbought condition, I use a 14-day slow stochastic, a popular technical indicator that calculates where the current price is relative to the high and low over a lookback period. A reading above 80% is deemed overbought.
On Monday, more than 87% of S&P 500 Financial sector stocks reached an overbought status, with the sector closing at a new high, a scenario that has occurred 15 other times since 1958. This phenomenon is known as a good overbought condition.
As shown in the chart below, when over 87% of stocks in the S&P 500 Financials sector reach an overbought status, as is the case now, the favorable price momentum tends to continue, resulting in an impressive annualized return of 63.5%. This overbought scenario challenges the conventional wisdom often echoed by social media pundits, who suggest an overbought condition is bad.
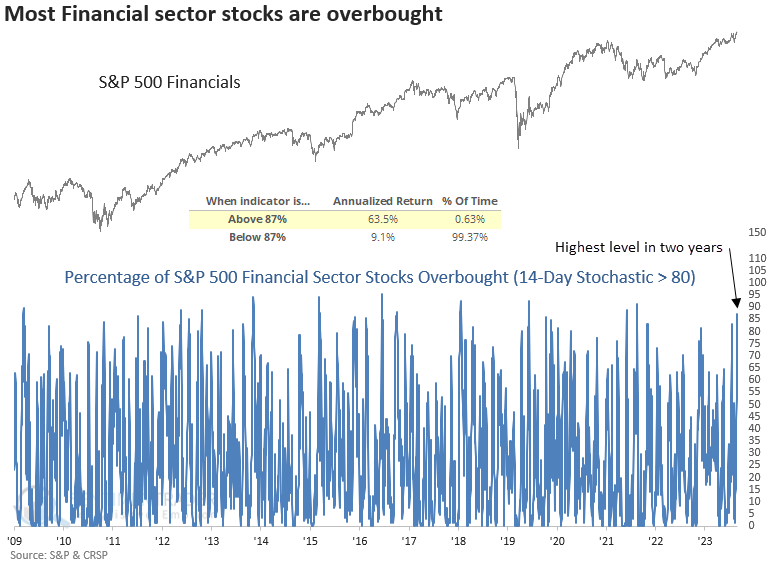
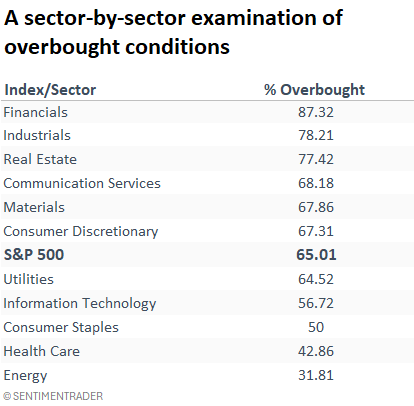
S&P 500 Financial sector stocks currently maintain the highest proportion of members with an overbought status and easily outpace the broad market reading of 65%.
An overbought condition preceded positive returns
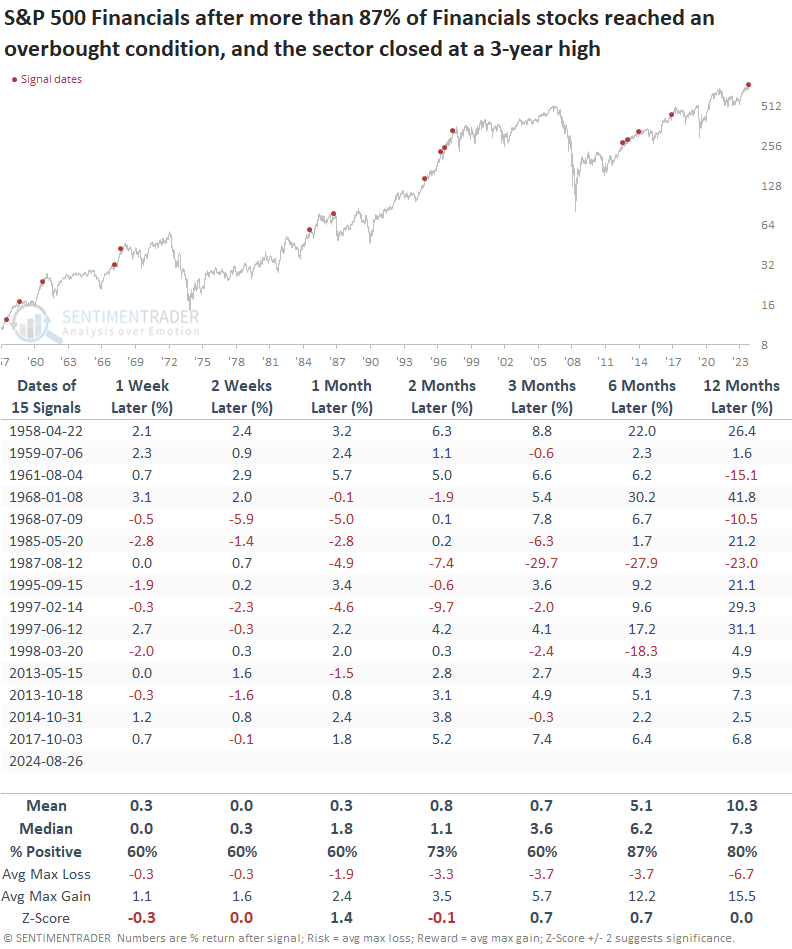
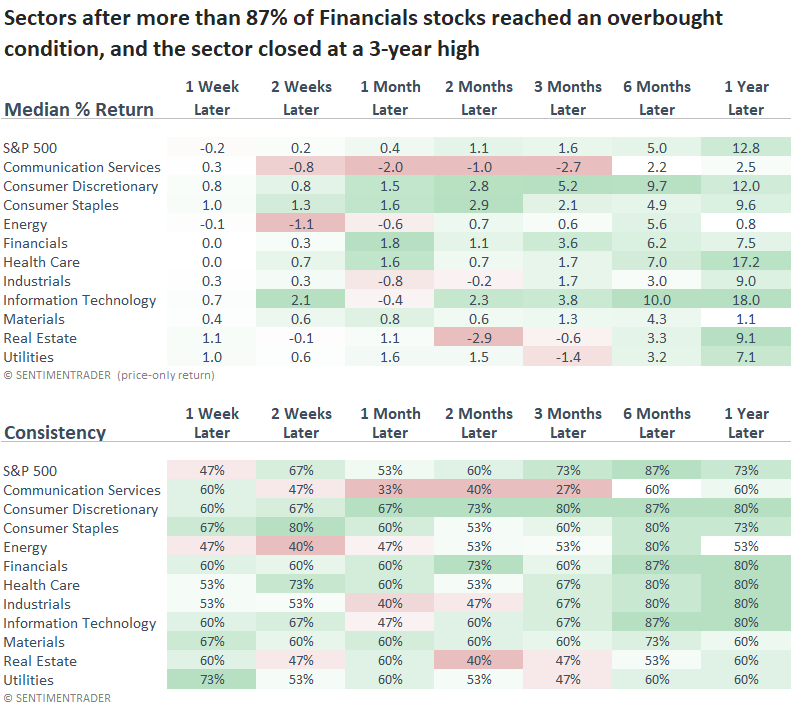
Following precedents when more than 87% of S&P 500 Financial sector stocks achieved an overbought status, with the index closing at a 3-year high, the sector tended to maintain its upward trajectory, rising 87% of the time over the subsequent six months. The sole exception to this good overbought condition occurred in August 1987, when the group formed an immediate top.
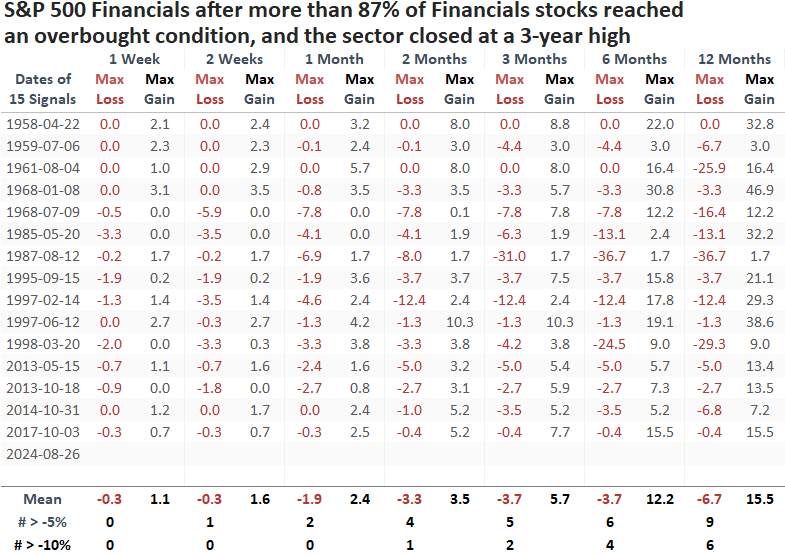
Over the next six months, the signal encountered a maximum loss exceeding -5% in 6 out of 15 cases and -10% in 4 out of 15 occurrences.
During the favorable six-month window, S&P 500 Financials outperformed the S&P 500 in five out of six intervals. A year later, Financials underperformed the S&P 500 and growth-oriented groups like Consumer Discretionary, Health Care, and Technology, possibly indicating that the signal was associated with sector rotation.
Opportunities within Financials
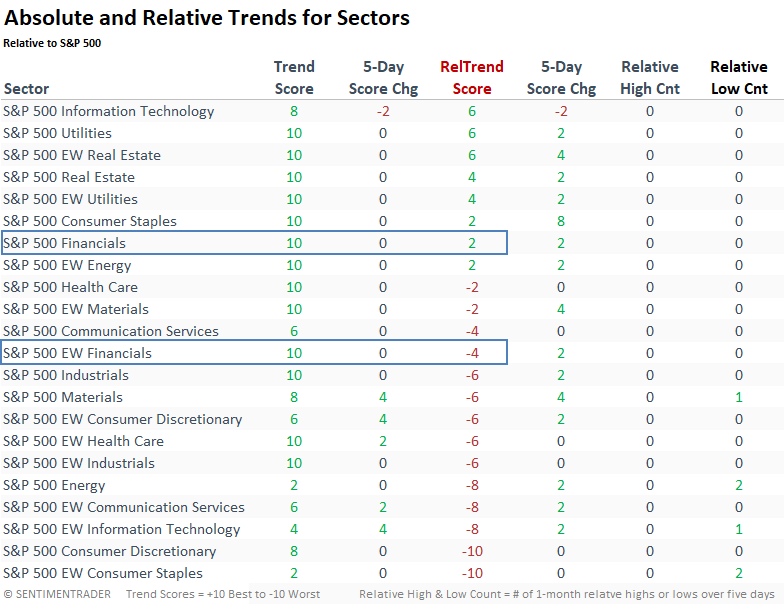
While the cap-weighted S&P 500 Financials sector, which investors can access via the ETF (XLF), currently maintains a positive relative trend score of 2 compared to the broad market, it's not a table-pounding buy from a relative perspective. Furthermore, the equal-weighted Financials show a relative trend score of -4, indicating that the positive backdrop in the cap-weighted version is likely driven by mega-cap stocks.
Given the uninspiring relative trend scores at the sector level, let's examine stock-specific trends.
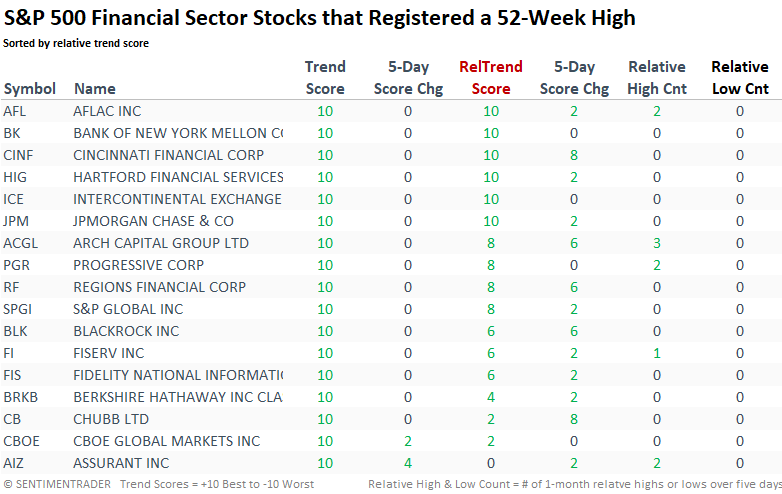
The following table contains S&P 500 Financial sector stocks that registered a 52-week high on Monday. All but one issue maintains a positive relative trend score, and several exhibit a bullish profile of 8 or higher. Additionally, the table features a broad spectrum of industries, covering everything from banking and insurance to market exchanges.
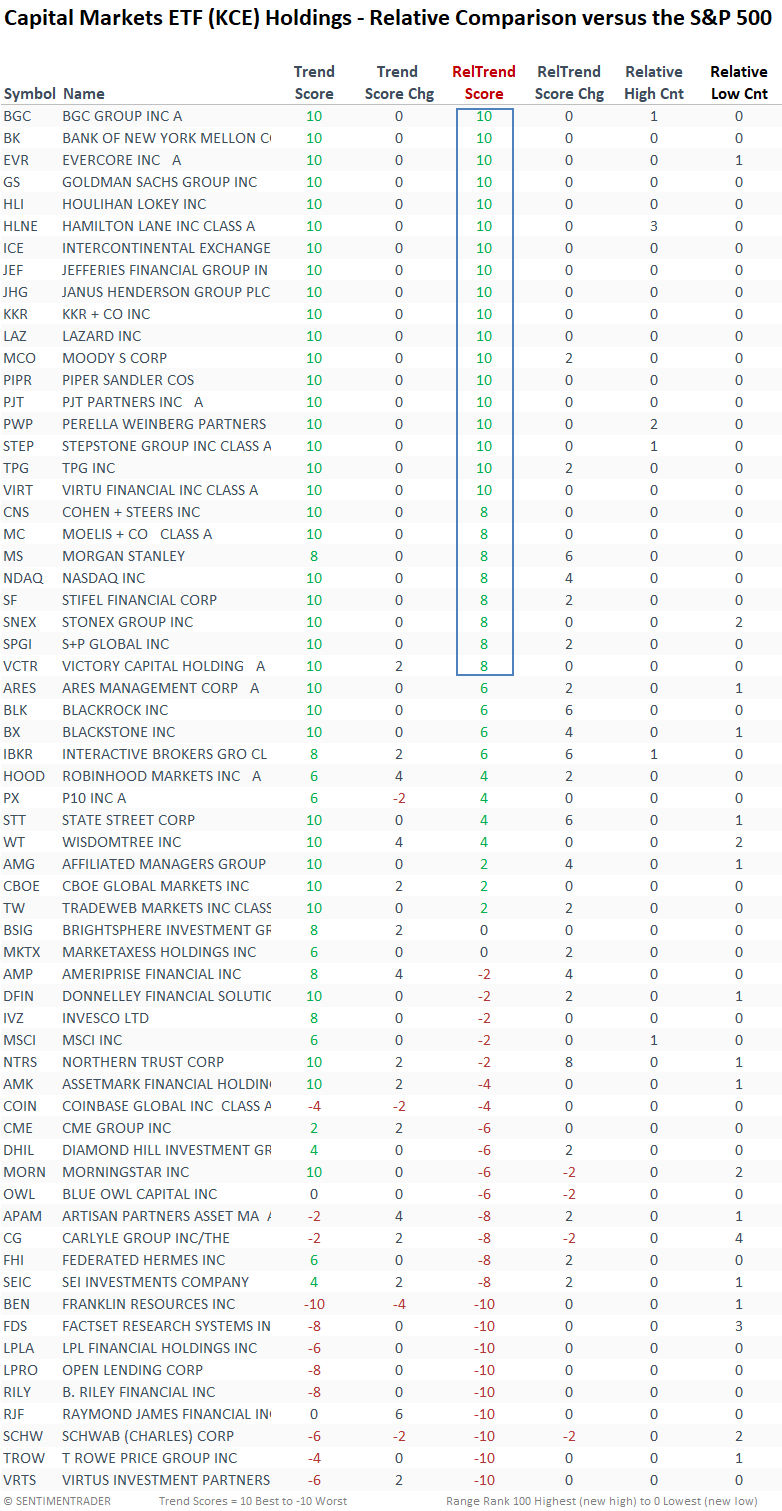
With IPOs and debt offerings increasing relative to 2023, the capital markets ETF (KCE) is an excellent place to assess stock-specific ideas.
Unsurprisingly, several investment banking firms are currently exhibiting favorable relative trend scores. In contrast, traditional asset management stocks are struggling.
What the research tells us...
Over the last week, Financials have generated two bullish breadth-based signals, indicating significant upside participation. When financials are in gear, it's generally a positive development for the broad market. With more than 87% of S&P 500 Financial sector stocks achieving an overbought condition as the sector closed at a high, the upside momentum for Financials and the S&P 500 should persist, notwithstanding the typical zigs and zags. While price and breadth indicators are positive, relative trends for the sector do not suggest a broad-based tailwind for the group. Therefore, investors should focus on individual stocks, where numerous opportunities exist.