Products
SentimenTrader Trading Tools
‍
Backtest Engine
My Trading Toolkit
Correlation Analysis
Seasonality
Market Prediction
Indicators & Data API
‍
Proprietary Indicators & Charts
Market Data API
Strategies & Scanner
‍
50+ Trading Strategies
Smart Stock Scanner
Smart Option Scanner
Research Reports
‍
Research Solutions
Reports Library
Free Resources
Simple Backtest Calculator
Simple Seasonality Calculator
The Kelly Criterion Calculator
Sentiment Geo Map
Public Research Reports
Education
Sentiment Indicators
Technical Indicators
Pricing
Company
About
In the News
Testimonials
Client Success Stories
Contact
Log inLoginSign up
< BACK TO ALL REPORTS

A bullish or bearish close below the 50-day average

Dean Christians
2023-08-16
The S&P 500 closed beneath its 50-day moving average, ending an impressive run of 95 straight trading days above this metric. Similar precedents led to an 86% win rate for the world's most benchmarked index over the next six months.

Key points:

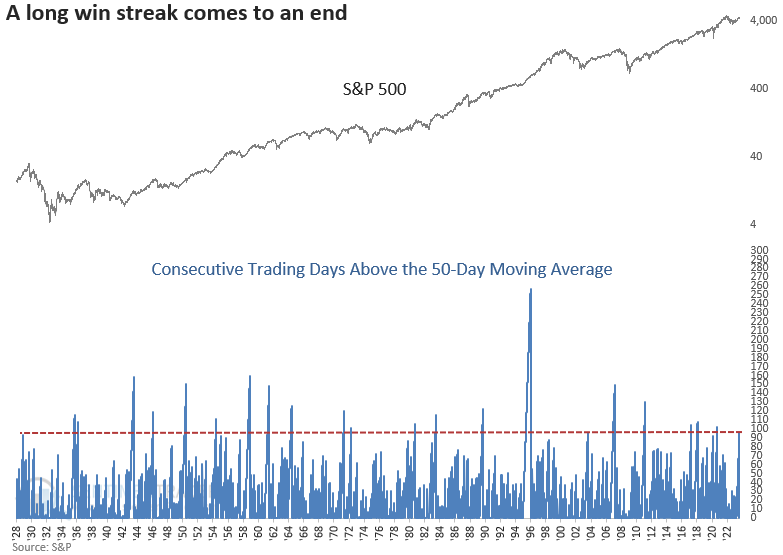
  • The S&P 500 closed below its 50-day moving average after an extended period above the average
  • Similar win streak price patterns suggest the S&P 500 could struggle in the near term
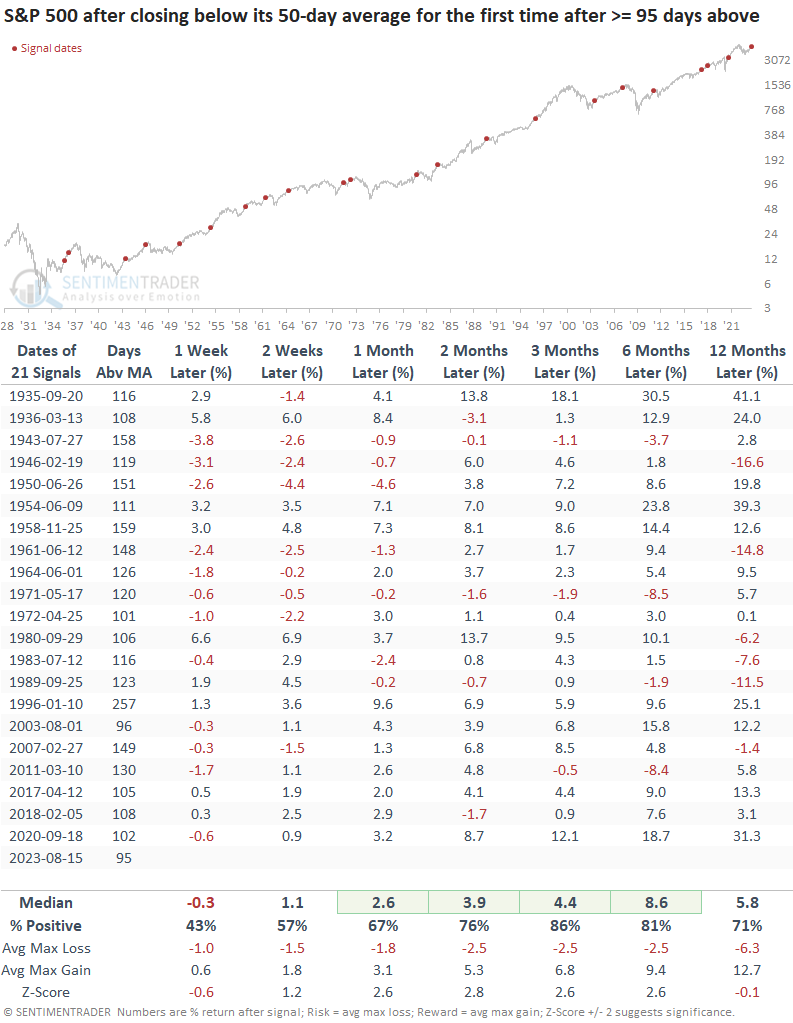
  • Traders should buy the dip as the S&P 500 was higher 86% of the time over the next three months

An extended duration above a moving average indicates a bullish trend

According to my calculation, the S&P 500 has crossed below its 50-day moving average 742 times since 1928. However, as we constantly emphasize in nearly every research note, context is critical when assessing historical patterns.

The S&P 500 closed below its 50-day moving average after registering at least 95 consecutive trading days above the average for only the 22nd time since 1928.

The ability of a stock or index to sustain itself above a moving average for a prolonged period is indicative of bull markets, not bear markets.

Similar win streak patterns led to positive returns for the S&P 500

In instances where the S&P 500 closed below its 50-day average after achieving at least 95 consecutive trading days above the average, the world's most benchmarked index tends to struggle in the very near term. However, traders should utilize any further downside to accumulate stocks. Three months later, the S&P 500 was higher 86% of the time.

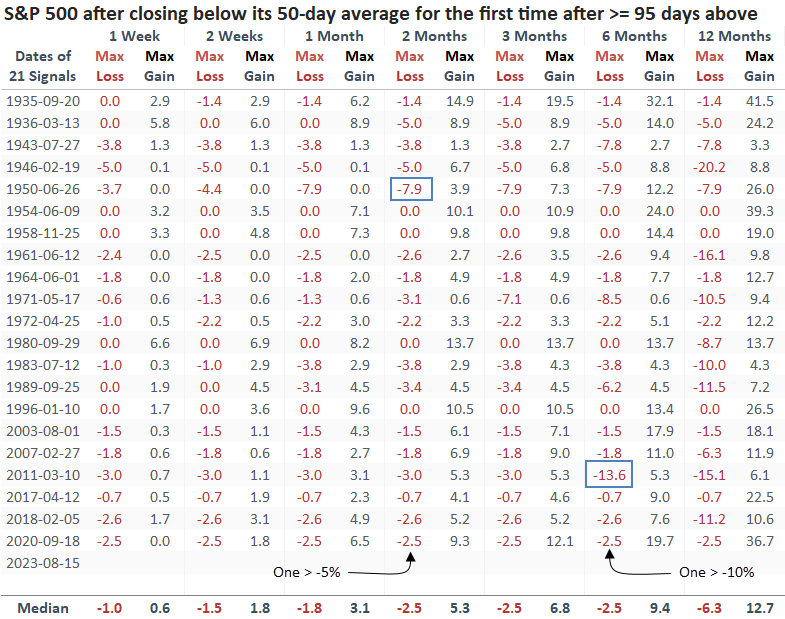
Signals that occurred prior to significant tops like 1946, 1972, 1980, and 2007 showed a max gain over the next six months of 8.8%, 5.1%, 13.7%, and 11%, respectively. In all four cases, the S&P 500 closed at new highs after breaking below the 50-day average.

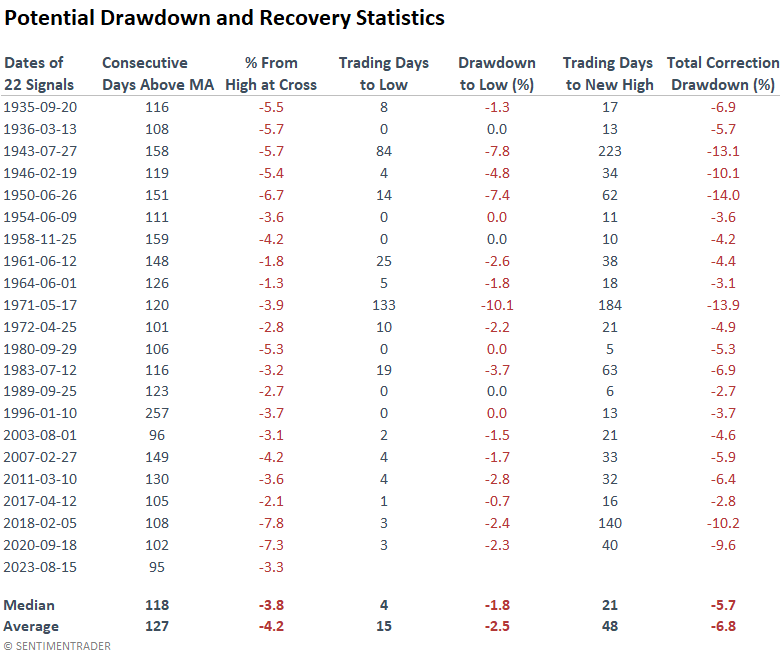
Corrections associated with a close below the 50-day average, similar to the present situation, show a median loss of -5.7% and an average loss of -6.8%. So, if history rhymes, a drawdown of a little over -6% could see the S&P 500 fall to roughly 4300, a reasonably typical bull market correction. The S&P 500's recovery to a new high after slipping beneath the 50-day average typically spans from one to two months later.

What the research tells us...

The S&P 500 closed below its 50-day moving average for the first time after sustaining itself above the average for 95 trading days. After similar win streak signals, the S&P 500 was higher 86% of the time over the next three months. However, history suggests the index could fall further before turning higher. So, traders should get ready to buy the dip.

PRODUCTS
SentimenTrader
Trading Tools
Indicators & Data API
‍
Strategies & Scanner
‍
Research Reports
FREE
RESOUrCES
Simple Backtest
Calculator
Simple Seasonality
Calculator
The Kelly Criterion
Calculator
Sentiment Geo Map
‍
Public Research Reports
‍
Education
Sentiment Indicators
‍
Technical Indicators
‍
Pricing
Bundle pricing
‍
FAQ
‍
Announcements
‍
COMPANY
‍
About
‍
In the News
‍
Testimonials
‍
Client Success Stories
CONTACT
‍
General Inquiries
‍
Media Inquiries
‍
Financial Professionals Inquiries
‍
© 2026 Sundial Capital Research Inc. All rights reserved.
Setsail Marketing
TermsPrivacyAffiliate Program
Risk Disclosure: The information and tools provided are for research and analytical purposes only and are not intended as investment advice. Market analysis involves uncertainty, and outcomes may differ from expectations. Users should conduct their own due diligence and consider their individual circumstances before making any financial decisions. Past performance is not necessarily indicative of future results.

Hypothetical Performance Disclosure: Hypothetical performance results have many inherent limitations, some of which are described below. No representation is being made that any account will or is likely to achieve profits or losses similar to those shown; in fact, there are frequently sharp differences between hypothetical performance results and the actual results subsequently achieved by any particular trading program. One of the limitations of hypothetical performance results is that they are generally prepared with the benefit of hindsight. In addition, hypothetical trading does not involve financial risk, and no hypothetical trading record can completely account for the impact of financial risk of actual trading. for example, the ability to withstand losses or to adhere to a particular trading program in spite of trading losses are material points which can also adversely affect actual trading results. There are numerous other factors related to the markets in general or to the implementation of any specific trading program which cannot be fully accounted for in the preparation of hypothetical performance results and all which can adversely affect trading results.

Testimonial Disclosure: Testimonials appearing on this website may not be representative of other clients or customers and is not a guarantee of future performance or success.