Products
SentimenTrader Trading Tools
‍
Backtest Engine
My Trading Toolkit
Correlation Analysis
Seasonality
Market Prediction
Indicators & Data API
‍
Proprietary Indicators & Charts
Market Data API
Strategies & Scanner
‍
50+ Trading Strategies
Smart Stock Scanner
Smart Option Scanner
Research Reports
‍
Research Solutions
Reports Library
Free Resources
Simple Backtest Calculator
Simple Seasonality Calculator
The Kelly Criterion Calculator
Sentiment Geo Map
Public Research Reports
Education
Sentiment Indicators
Technical Indicators
Pricing
Company
About
In the News
Testimonials
Client Success Stories
Contact
Log inLoginSign up
< BACK TO ALL REPORTS

A bullish momentum signal for a traditionally defensive sector

Dean Christians
2023-05-08
For only the 16th time since 1947, the Consumer Staples sector triggered a deviation from trend buy signal. After similar precedents, the group was higher 93% of the time over the next year.

Key points:

  • The S&P 500 Consumer Staples sector triggered a price momentum buy signal
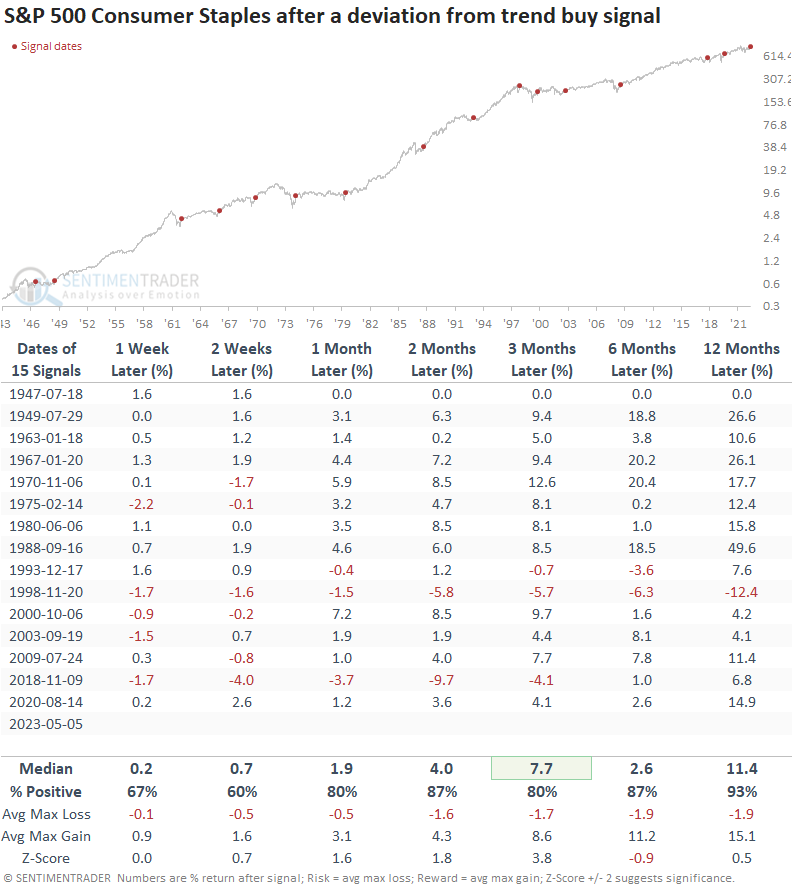
  • After similar alerts, the group was higher 93% of the time over the next year
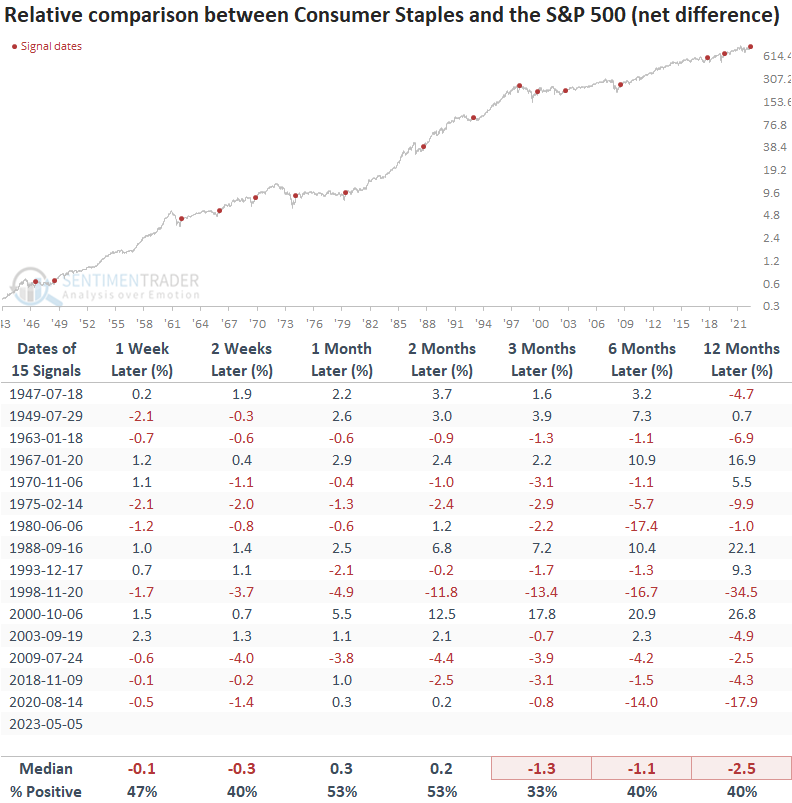
  • While returns for Consumer Staples are positive, the index tends to underperform the broad market

Price momentum for the Consumer Staples sector 

Last week my colleague Jay Kaeppel published a research note highlighting a bullish seasonal trend for the Consumer Staples and Health Care sectors. 

The bullish side of the ledger for the Consumer Staples sector looks more compelling now that a price momentum indicator registered a new buy signal.

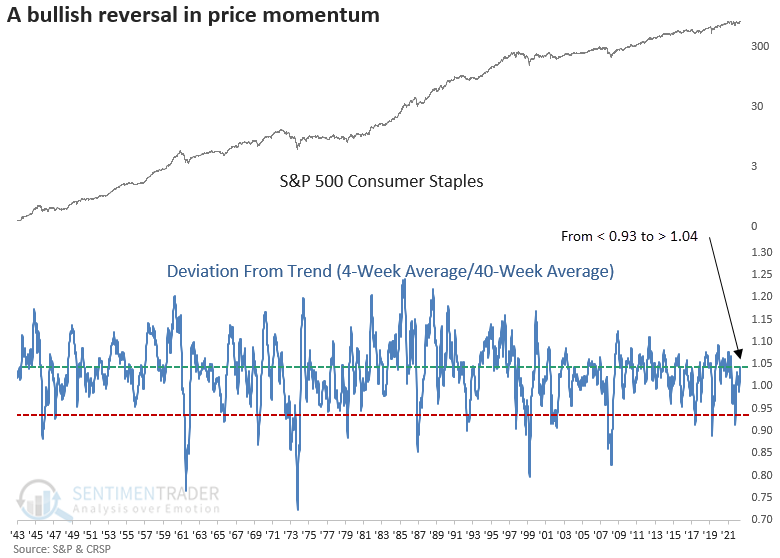
For only the 16th time in the post-WWII era, the traditionally defensive sector registered a deviation from trend buy signal. The system measures the 4-week moving average for the sector relative to the 40-week average. An alert occurs when the ratio between the two averages cycles from less than 0.93 to greater than 1.04.

Similar reversals preceded positive returns for the sector

When the ratio between the short and long-term moving average for the Consumer Staples sector cycles from < 0.93 to > 1.04, the traditionally defensive group shows solid returns and win rates across almost all time frames, especially a year later. 

Typically, the signals occur after significant drawdown periods for the broad market. The alerts in 1998 and 2000 were unusual as they happened near the beginning of the Dotcom bust. 

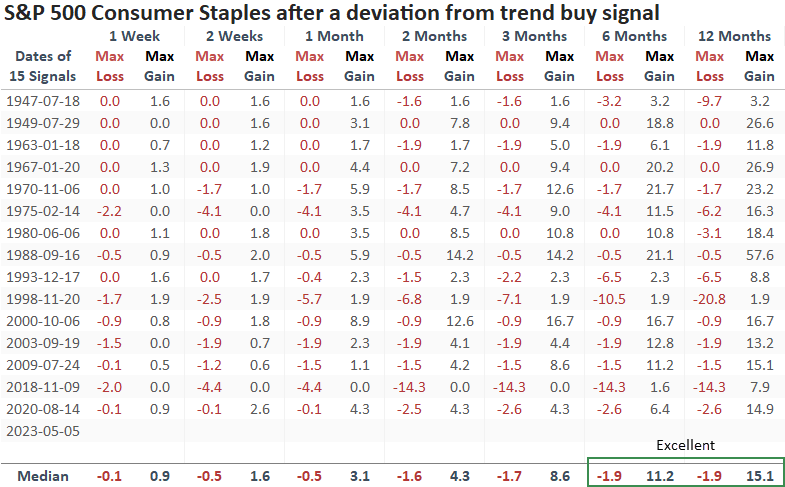
Only 2 out of 15 signals showed a max loss drawdown of greater than -10%, and only one of those precedents occurred in the first two months.

When I apply the signals to the S&P 500, returns and win rates look solid. The Consumer Staples momentum signal typically coincides with bullish broad market price action found in the early stages of a new bull market. 1947 and 2000 are the exceptions.

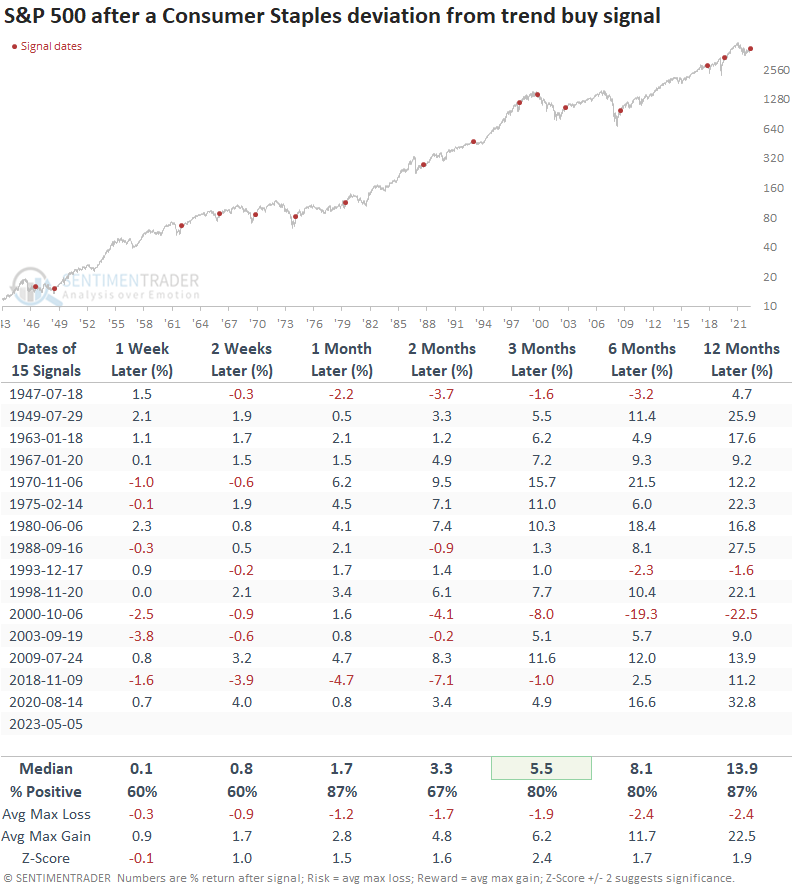
Suppose I net out the difference in returns between the Consumer Staples sector and the S&P 500. In that case, Consumer Staples underperform the S&P 500 across most time horizons, especially as the new cycle matures.

What the research tells us...

Price momentum for the Consumer Staples sector cycled from bearish to bullish. After similar precedents, the group was higher 93% of the time over the next year, with only two max loss drawdowns greater than -10%. Historically, the shift in momentum occurs after the broad market transitions from a bear to a bull market environment. While returns for the Consumer Staples sector are solid, history suggests the traditionally defensive group could underperform the S&P 500. 

PRODUCTS
SentimenTrader
Trading Tools
Indicators & Data API
‍
Strategies & Scanner
‍
Research Reports
FREE
RESOUrCES
Simple Backtest
Calculator
Simple Seasonality
Calculator
The Kelly Criterion
Calculator
Sentiment Geo Map
‍
Public Research Reports
‍
Education
Sentiment Indicators
‍
Technical Indicators
‍
Pricing
Bundle pricing
‍
FAQ
‍
Announcements
‍
COMPANY
‍
About
‍
In the News
‍
Testimonials
‍
Client Success Stories
CONTACT
‍
General Inquiries
‍
Media Inquiries
‍
Financial Professionals Inquiries
‍
© 2026 Sundial Capital Research Inc. All rights reserved.
Setsail Marketing
TermsPrivacyAffiliate Program
Risk Disclosure: The information and tools provided are for research and analytical purposes only and are not intended as investment advice. Market analysis involves uncertainty, and outcomes may differ from expectations. Users should conduct their own due diligence and consider their individual circumstances before making any financial decisions. Past performance is not necessarily indicative of future results.

Hypothetical Performance Disclosure: Hypothetical performance results have many inherent limitations, some of which are described below. No representation is being made that any account will or is likely to achieve profits or losses similar to those shown; in fact, there are frequently sharp differences between hypothetical performance results and the actual results subsequently achieved by any particular trading program. One of the limitations of hypothetical performance results is that they are generally prepared with the benefit of hindsight. In addition, hypothetical trading does not involve financial risk, and no hypothetical trading record can completely account for the impact of financial risk of actual trading. for example, the ability to withstand losses or to adhere to a particular trading program in spite of trading losses are material points which can also adversely affect actual trading results. There are numerous other factors related to the markets in general or to the implementation of any specific trading program which cannot be fully accounted for in the preparation of hypothetical performance results and all which can adversely affect trading results.

Testimonial Disclosure: Testimonials appearing on this website may not be representative of other clients or customers and is not a guarantee of future performance or success.