
A bullish message from the fear gauge

Key points:
- Last Friday, the Volatility Index (VIX) dipped below 12, signaling decreased anxiety among investors
- Similar conditions suggest the S&P 500 could consolidate the recent gains over the next few weeks
- A year later, the world's most benchmarked index was higher in all but one case
Should we fear the historically low reading in the Volatility Index
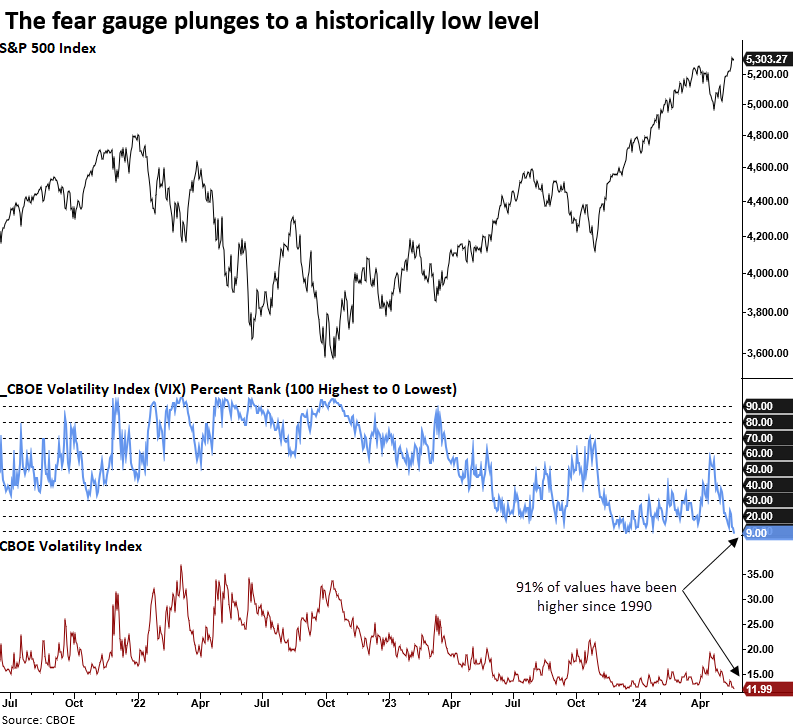
Following the equity market correction in April and several pivotal events, such as the FOMC meeting and the release of the CPI report, the Volatility Index (VIX), a measure of 30-day expected volatility derived from call and put options on the S&P 500 Index, plunged below 12 for the first time in over four years.
A low VIX generally indicates a market environment where investors expect less volatility and feel more confident. This confidence often translates into stable or rising stock prices because investors are more willing to invest in equities when they feel the risk is diminished.
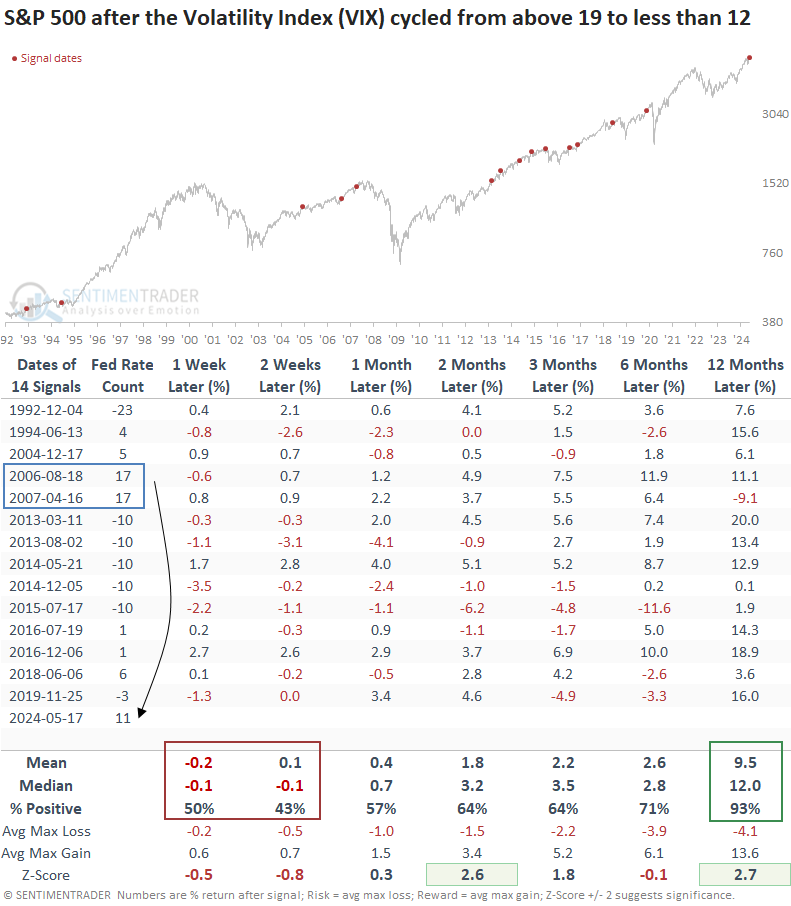
The last instance when the VIX fell below 12 after rising to 19 or higher, resembling the recent occurrence, was in November 2019, which led to a 4.6% increase in the S&P 500 over the ensuing two months.
Similar patterns in the Volatility Index usually result in a brief pause for stocks
Whenever the Volatility Index (VIX) shifted from above 19 to below 12, the S&P 500 tended to consolidate its recent gains over the subsequent two weeks. A continuation of the uptrend followed this pause, with the index recording gains a year later in all but one case.
Interestingly, the Volatility Index dropped below 12 on two separate occasions after the Federal Reserve hit the pause button following 17 interest rate hikes between 2004 and 2006. In both cases, the S&P 500 was higher six months later.
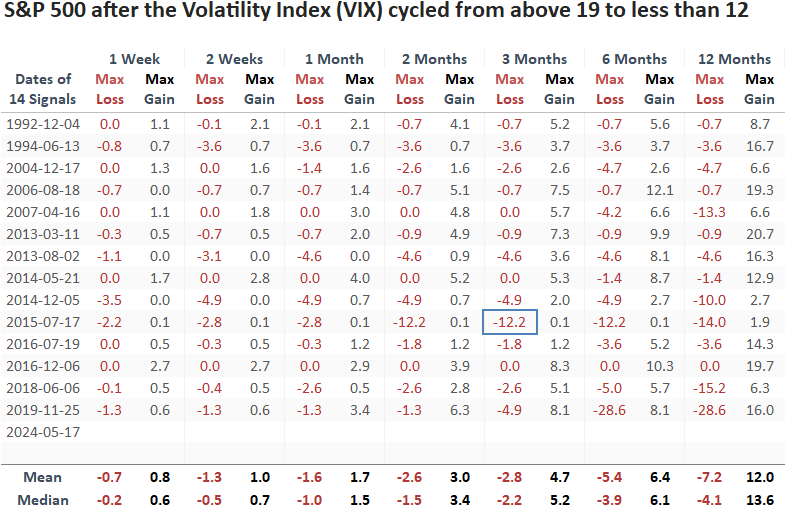
Over the ensuing three months, the maximum loss exceeded -5% only once, challenging the commonly held belief that a low VIX signals dangerous complacency. In reality, it's more indicative of a long-term uptrend.
With the VIX lower than 91% of all historical values since 1990, the likelihood of further downside is limited. This explains the consistently high percent positive readings across all time horizons in the following outlook table.
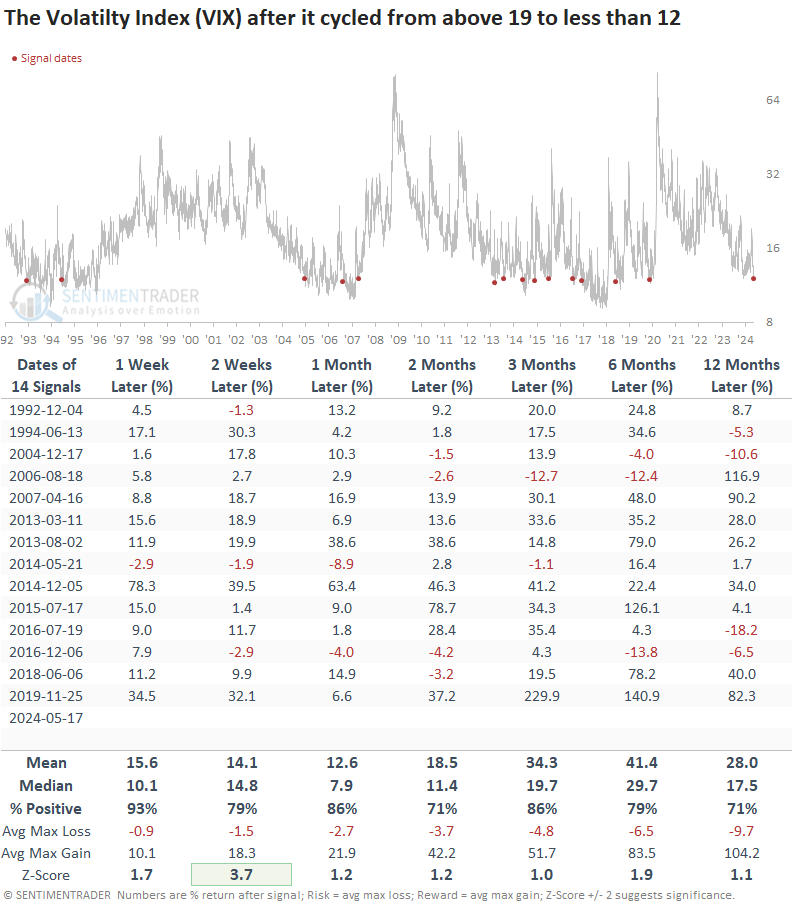
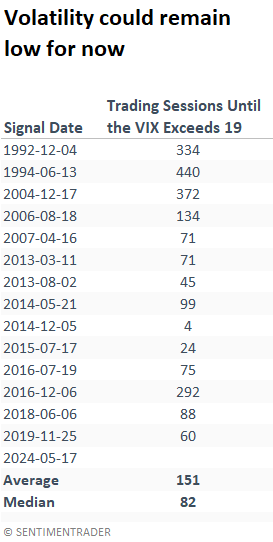
Following periods when the Volatility Index cycled from above 19 to below 12, it usually takes about 82 trading sessions to rebound above the reset level of 19, which mirrors the VIX's average value since 1990. Consequently, while history suggests an uptick in volatility, it's likely to be contained within a specific range, benefitting stocks.
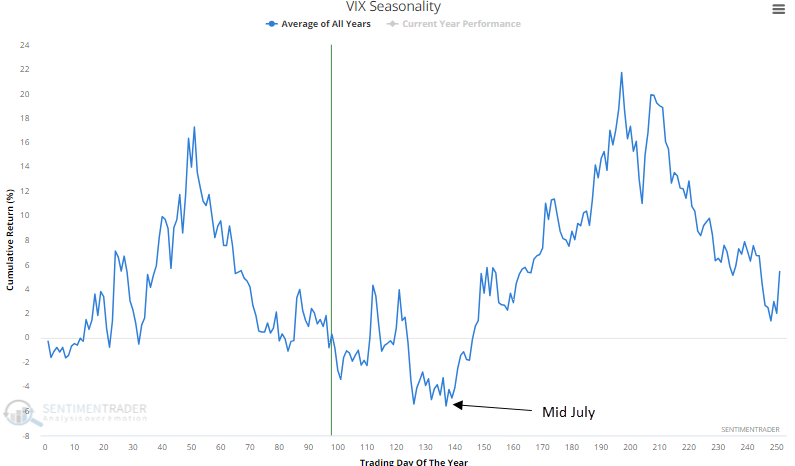
Seasonality lends further credence to the likelihood of rangebound volatility, with the VIX trending lower until mid-July.
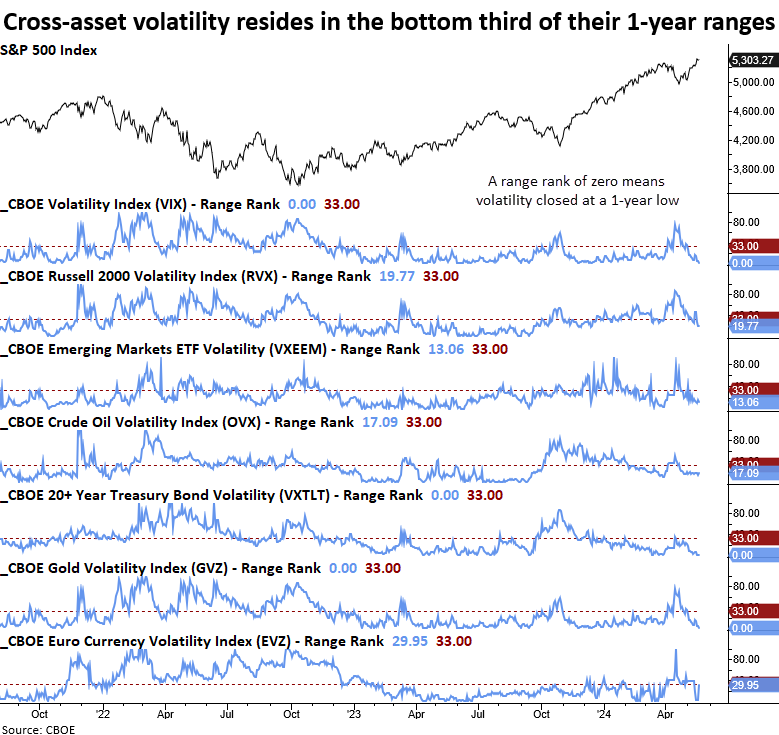
What about other asset classes
It's not just the VIX that is falling to new lows. The volatility index for other asset classes has collapsed near the bottom end of their 1-year ranges.
What the research tells us...
The Volatility Index (VIX) cycled from above 19 to less than 12, suggesting investors are less concerned about an imminent risk-off scenario. Although a compression in volatility, like now, can lead to a short-term consolidation in stocks, it's typically nothing more than a pause that refreshes a bullish trend. A year later, the S&P 500 was higher 93% of the time. Because expected volatility is low relative to history, don't be surprised if the VIX rises from current levels. However, it's likely within the context of a rangebound environment.