
A bullish message from oil and gold

Key points:
- The performance of crude oil relative to gold has been an effective indicator for the stock market
- Low readings in the crude oil versus gold ratio have been favorable for stocks
- High readings have been infrequent, and with starkly different outcomes
Crude oil vs. gold vs. stocks
Gold is the most followed commodity in the world, with some referring to it as the ultimate store of value. Meanwhile, others refer to crude oil as the most essential commodity in the world. Whatever the assertions, the two have an interesting relationship.
The WTI/Gold Ratio measures the ratio between West Texas Intermediate crude oil and gold prices. Calculated as the price of a barrel of WTI oil divided by the cost of an ounce of gold, this ratio reflects the value of an industrial commodity relative to a safe-haven asset. In theory, a rising ratio suggests global economic growth; a declining ratio indicates economic weakness, geopolitical risk, or investors' flight to safety.
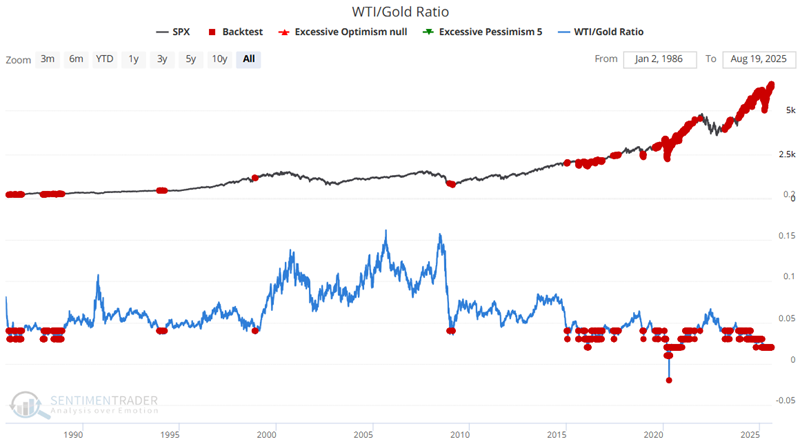
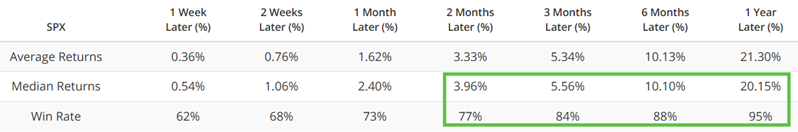
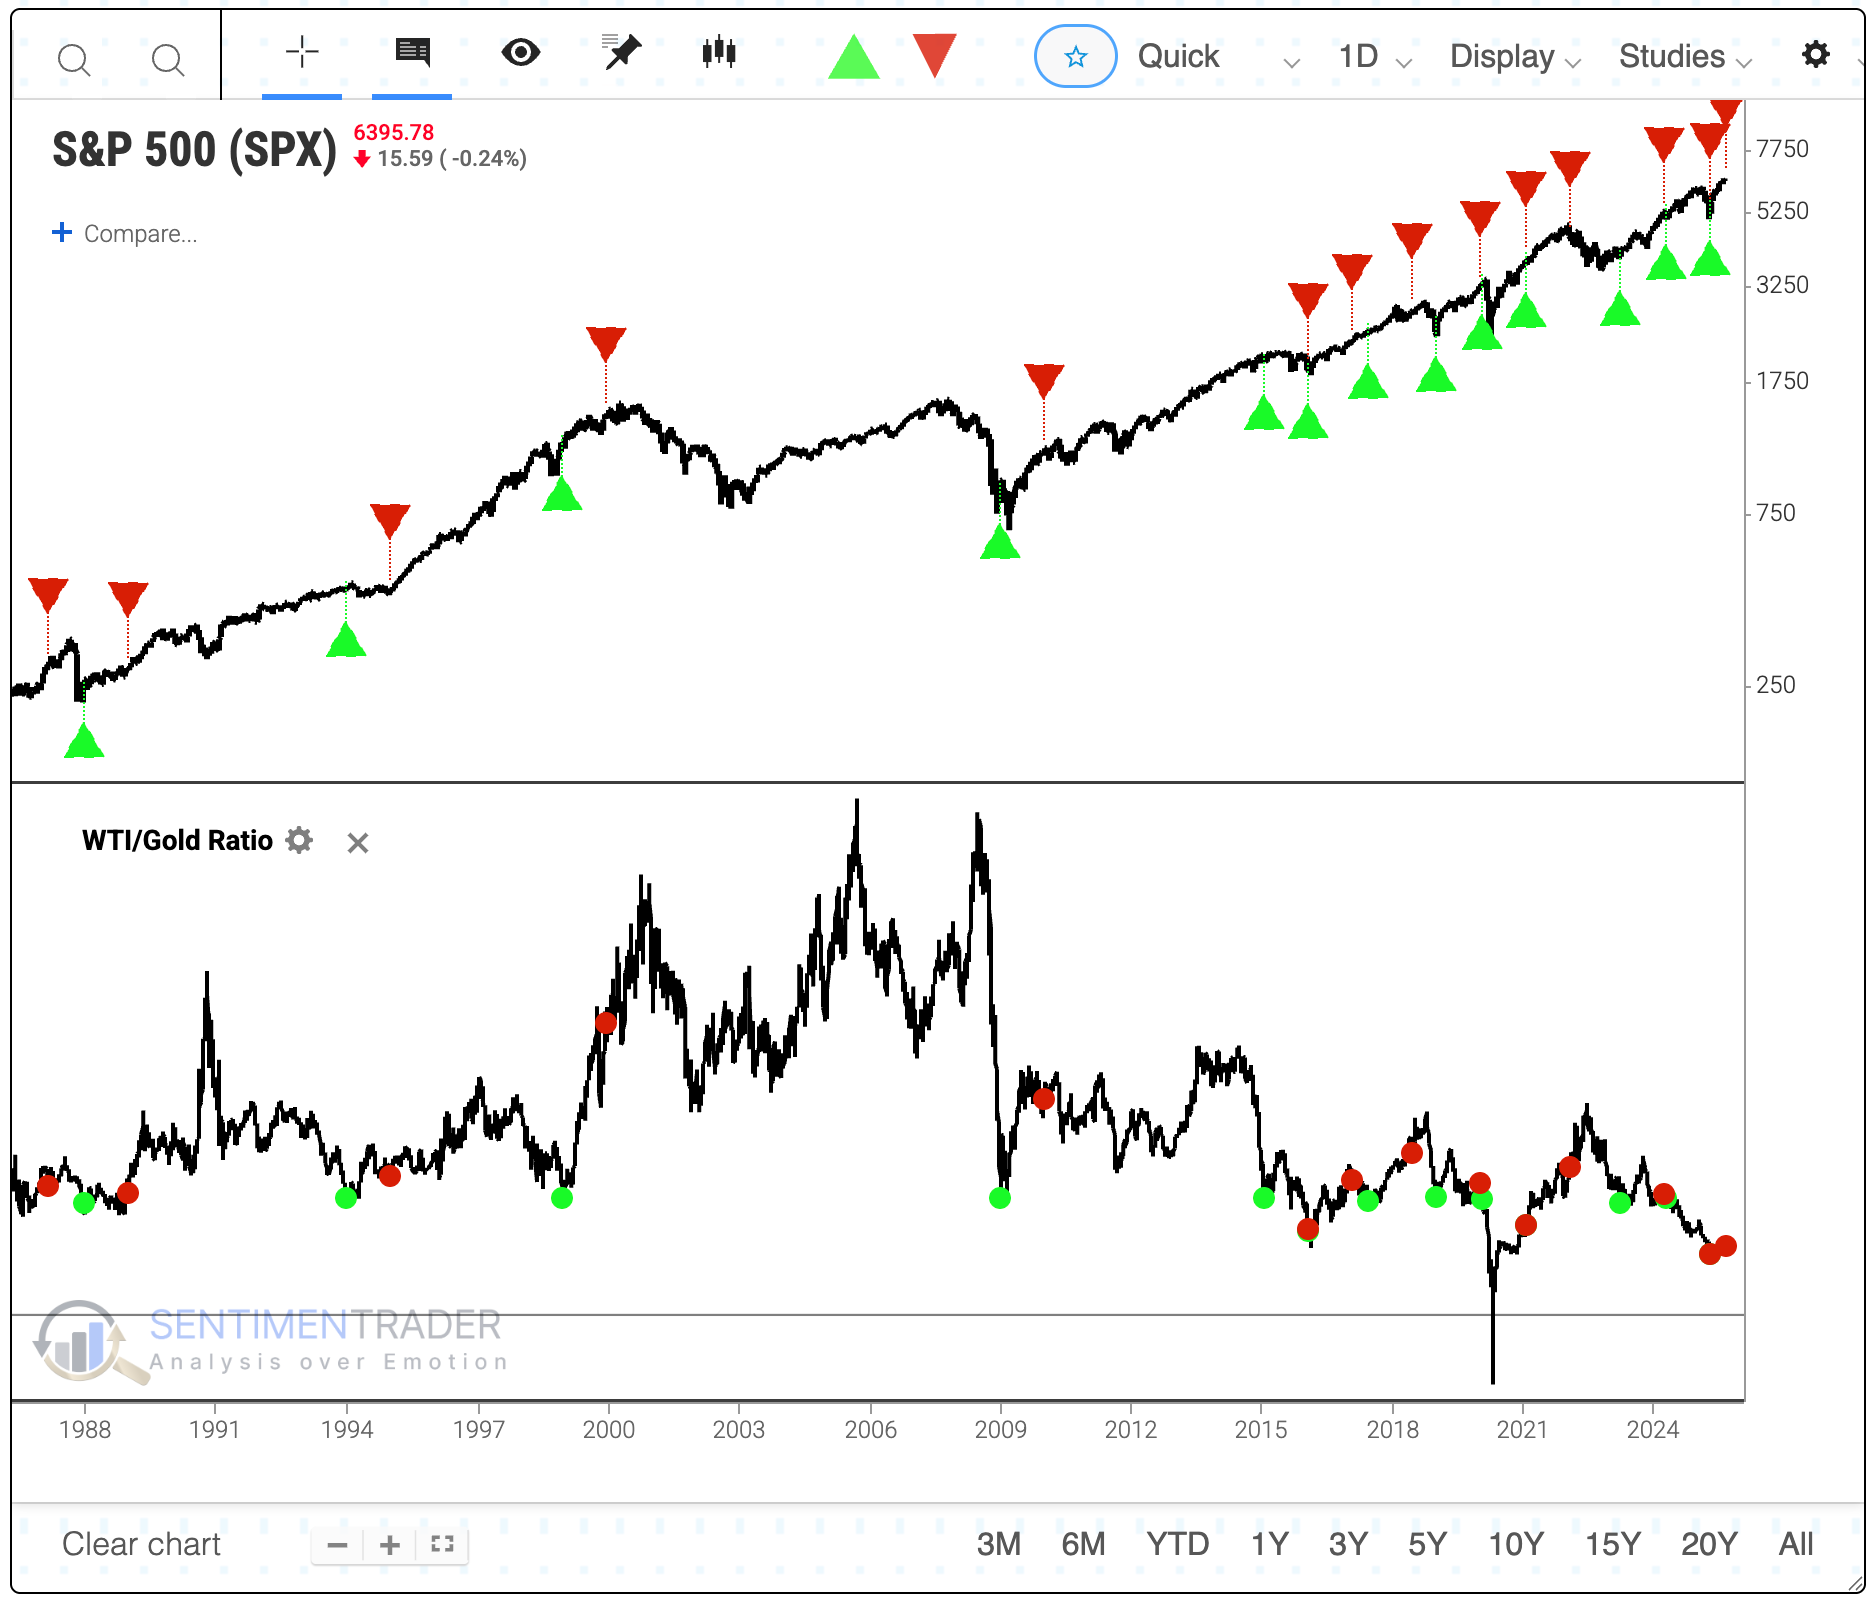
The stock market appears to like cheap energy. This is not surprising since it takes energy to make an economy hum. We will first look at when the WTI/Gold Ratio was 0.037 or lower. This happened several times in the late 1980s, a few in the 1990s, only once in the 2000s, and relatively frequently since 2015. The S&P 500 witnessed solid win rates and median returns across the board, with a median return greater than 20% a year later.
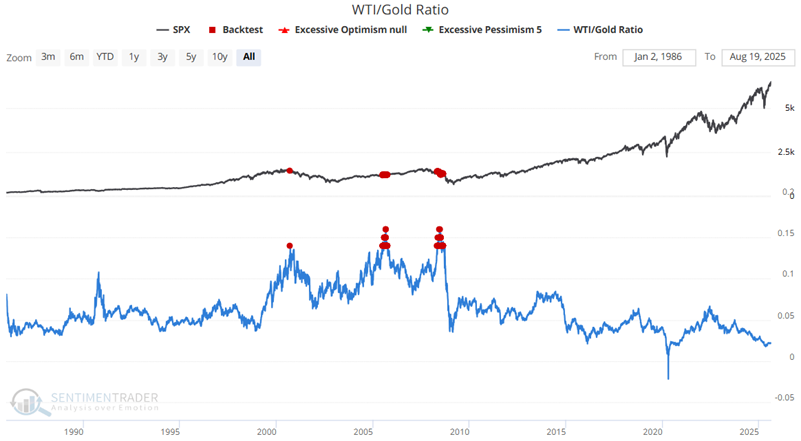
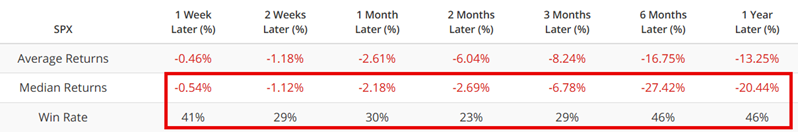
Conversely, the WTI/Gold Ratio has been above 0.137 only a handful of times, including in 2000, 2005, and 2008. The signals were clustered during those periods, and the S&P's returns were poor.
A more systematic approach
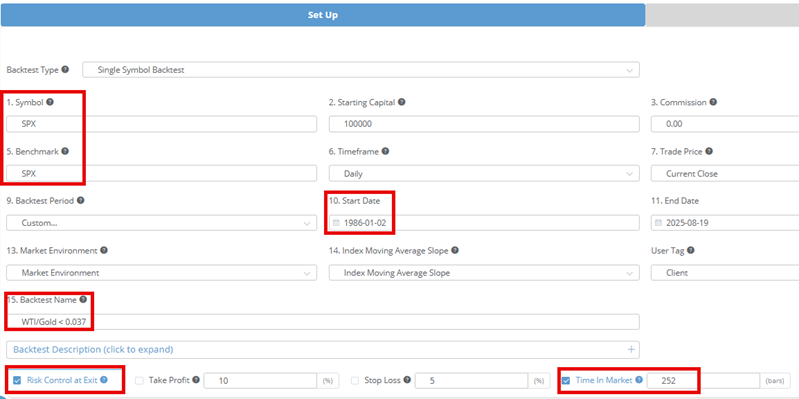
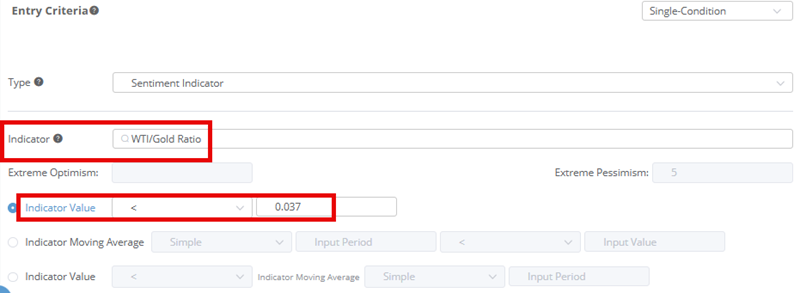
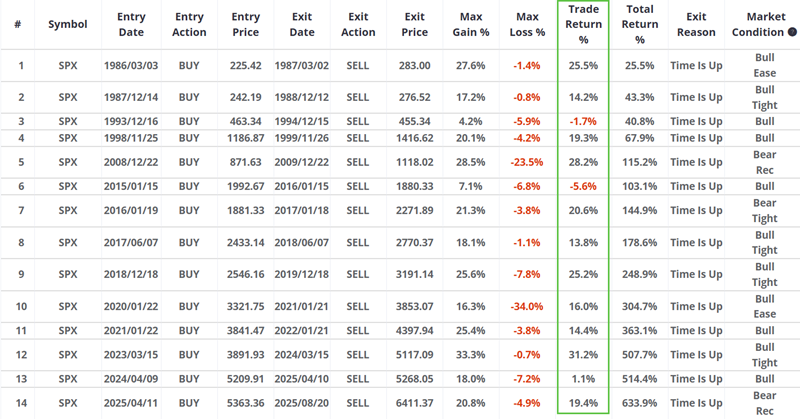
For the following test, we will assume that we will buy the S&P 500 Index when the WTI/Gold Ratio drops below 0.037 and hold that position for 252 trading days, or one year. You can find this test here in Backtest Engine 2.0 under Analysts' Backtests.
To set up this test initially, we input the settings highlighted below and clicked Run Backtest.
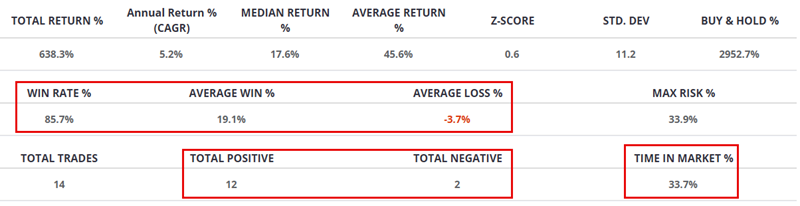
The green arrows on the S&P 500 bar chart highlight entry signals, and the red arrows indicate exit signals. This approach was only in stocks 34% of the time. The win rate was 86%, and the win/loss ratio was very favorable, with an average win of 19% versus an average loss of roughly 4%.
The most recent entry signal occurred on April 11th and is updated through August 18th. This hypothetical strategy will continue to hold the S&P 500 until April 2026, but the S&P has already met the average return for winning trades. Of course, some signals continued to rally significantly beyond the average return, and since the ratio remains low, it suggests stocks could continue to run.
What the research tells us…
The stock market performs best when it anticipates economic strength. One key element for sustaining that strength is the availability of abundant and affordable energy.
The WTI/Gold Ratio measures the price of the primary energy source relative to the world's pre-eminent physical commodity. In the past 40 years, the stock market has performed significantly better when the relative energy cost is at the low end of the range and worse at the high end. It is low now, which bodes well for the stock market.