
A bullish market message from economically sensitive small-cap stocks

Key points:
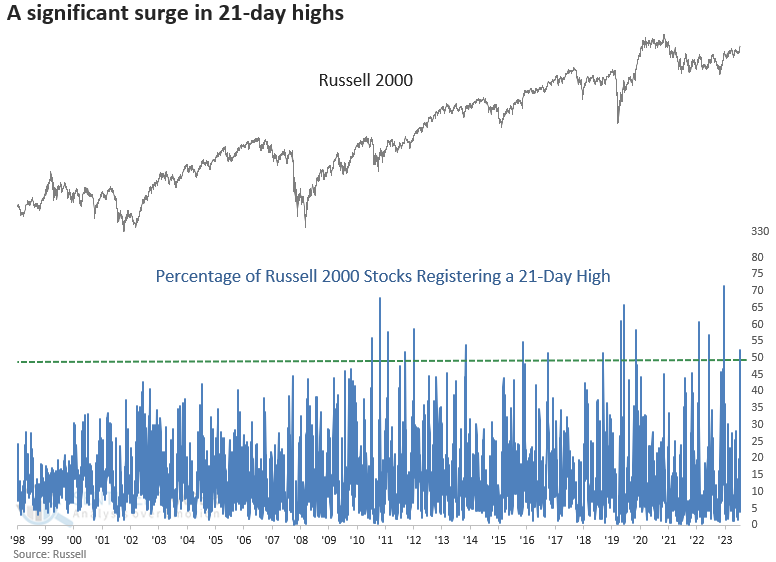
- The percentage of Russell 2000 stocks registering a 21-day high surged above 50%
- Similar breadth thrusts produced a favorable outlook for the Russell 2000 over the subsequent year
- When economically sensitive small-cap stocks exhibit bullish breadth, it bodes well for large-caps
A surge in economically sensitive small-cap stocks alleviates the participation problem
In several research notes, I highlighted the lack of participation from most stocks, which usually indicates a weak foundation for uptrends. However, I also noted that this narrowing breadth might signify sector rotation, a phenomenon that sometimes occurs in bull markets. Remember, no indicator is foolproof.
After an impressive stock rally in recent days, market breadth has broadened considerably, easing worries about participation.
On Monday, more than 50% of Russell 2000 stocks reached a 21-day high, a feat achieved only 24 times since 1979. The last occurrence was in December 2023, resulting in notable gains over the next three months.
Comparable breadth thrusts preceded a favorable outlook for small-cap stocks
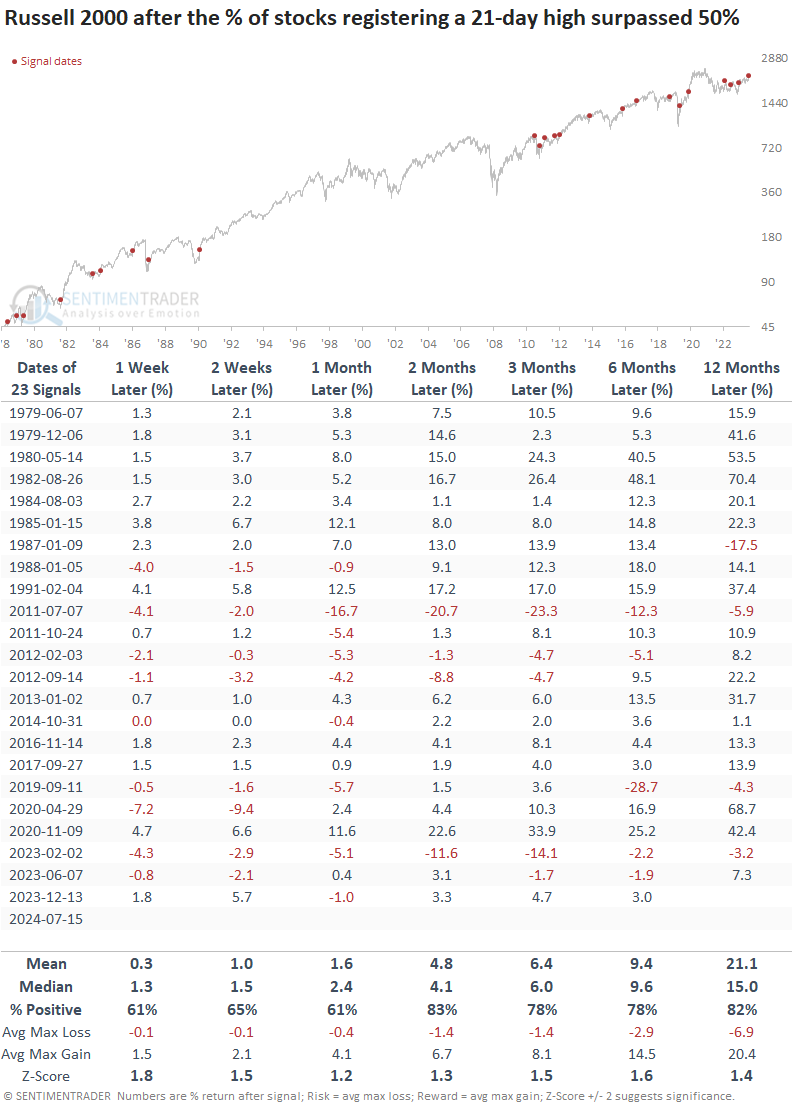
Following instances when the percentage of Russell 2000 stocks that registered a 21-day high surpassed 50%, the small-cap index displayed solid returns and consistency over the subsequent year, rising 82% of the time.
While the 2023 signals showed a mixed outlook, it's critical to recognize that the FOMC officially paused its rate-hiking cycle in July 2023. So, two out of three of those precedents occurred within the context of a hawkish Fed.
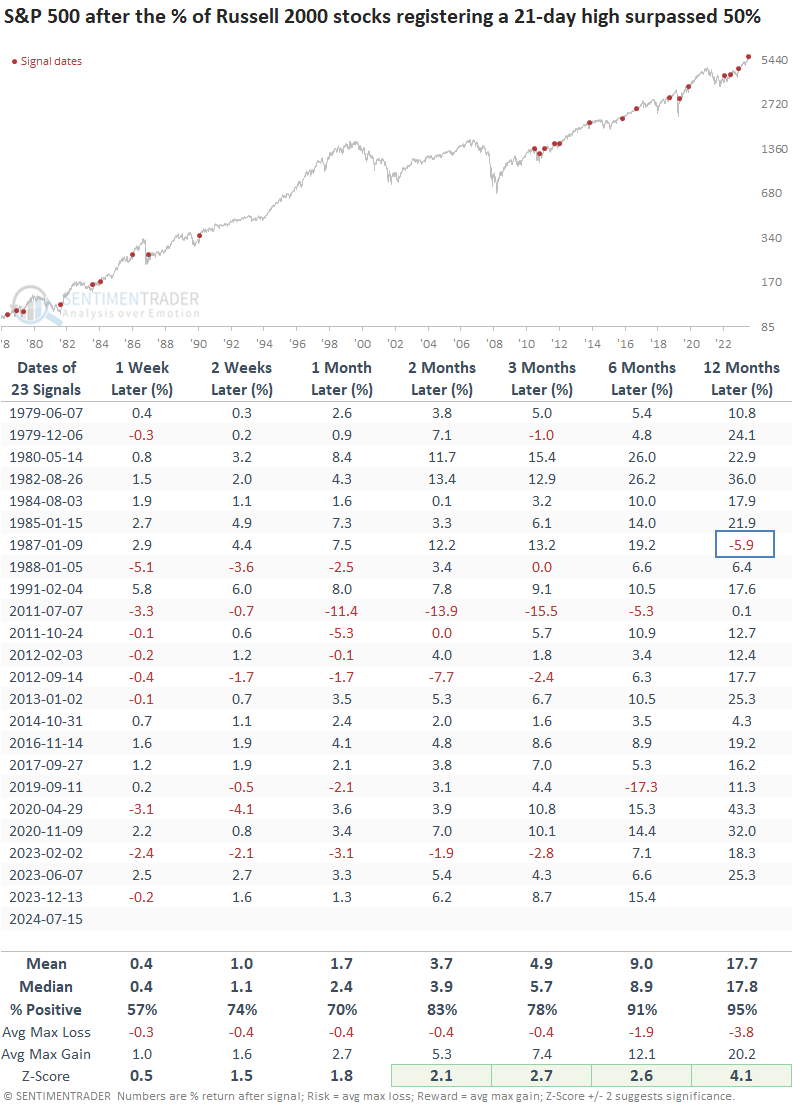
A significant surge in economically sensitive small-cap stocks bodes well for the world's most benchmarked index. Over the subsequent year, the S&P 500 was higher 95% of the time, with the lone loss occurring due to the 1987 crash. Furthermore, the two most significant drawdowns over the six-month window coincided with the European debt crisis and COVID-19.
So, deviating from the norm typically takes an unusual event.
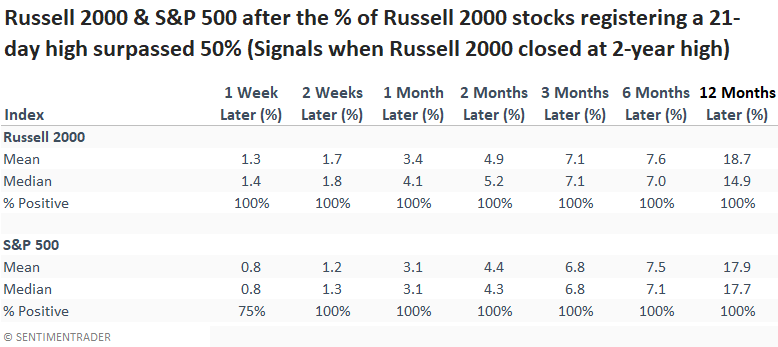
As always, context is essential when assessing historical data. While the sample size is small (four other instances), whenever the percentage of Russell 2000 stocks registering a 21-day high coincided with a 2-year high in the index, the Russell 2000 and the S&P 500 displayed a 100% win rate from two weeks to twelve months later.
Over the next three months, the median return for the Russell 2000 exceeded the S&P 500's return in each time frame.
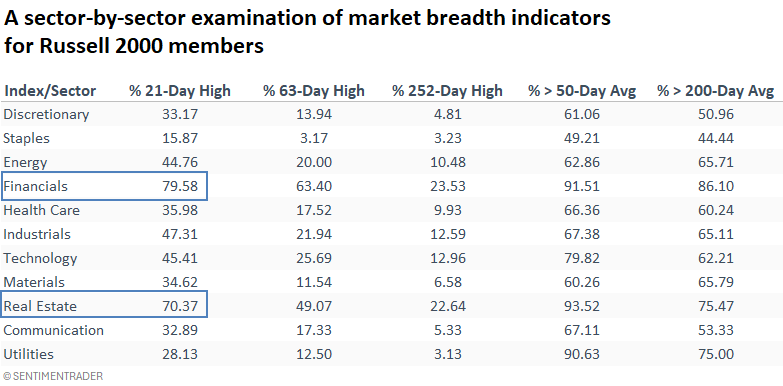
The Financial sector dominated the new highs list
New highs across all time frames were most prevalent in Financials and Real Estate. Within the Russell 2000 Financials, banks comprise a significant proportion of the constituents. These stocks have seen a notable uptick, driven by the expectation that rate relief from the Federal Reserve will mitigate potential issues in commercial real estate, where banks have significant exposure.
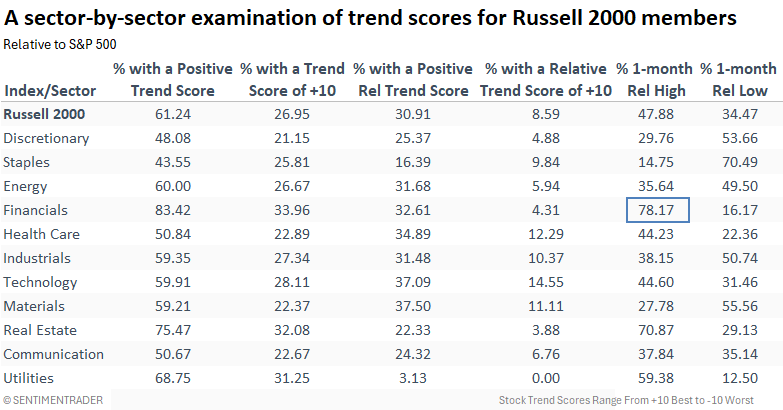
Relative highs versus the S&P 500
Financials not only recorded the highest percentage of 21-day highs but also showed the greatest percentage of 21-day relative highs against the S&P 500 over the past 5 sessions, reaching 78%.
What the research tells us...
Small-cap stocks are surging, which is bullish for small-and large-cap indexes as these stocks are the most sensitive to shifts in economic conditions. While growth has been softening of late, a reversal in Fed policy could turn the tide the other way, potentially benefiting small-caps. However, it's essential to recognize that an index like the Russell 2000 does not trend like the S&P 500. i.e., it's much more choppy. Therefore, it's critical to be selective and drill down to individual sectors, industries, or stocks. If you have to own something like the Russell 2000 ETF (IWM), I would view it as a trade to rent rather than a core holding.