
A bullish increase in new lows

Key points:
- Over 47% of S&P 500 stocks closed at a 1-month low, with less than 3.5% of stocks hitting a 12-month low
- Similar oversold conditions in an uptrend suggest buying the dip, especially since 1950
- Results in the seasonally weak months between August and October are excellent
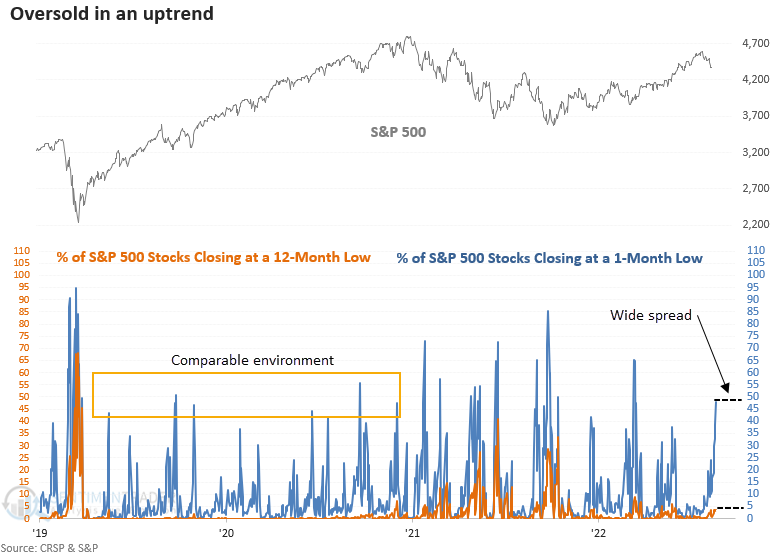
Healthy uptrends generally correspond with a minimal number of 12-month lows
If I had to follow one market breadth indicator when stocks are in an uptrend, it would be annual lows. When stocks advance, and 12-month lows are abnormally high, all is not well with the internal condition of the market. Followers of the TCTM Risk Warning Model know the composite heavily emphasizes long-duration lows.
On Friday, 1-month lows for stocks in the S&P 500 surged to 47%, the highest level since March. However, when I checked long-duration lows, I noticed fewer than 3.5% of stocks closed at a 12-month low.
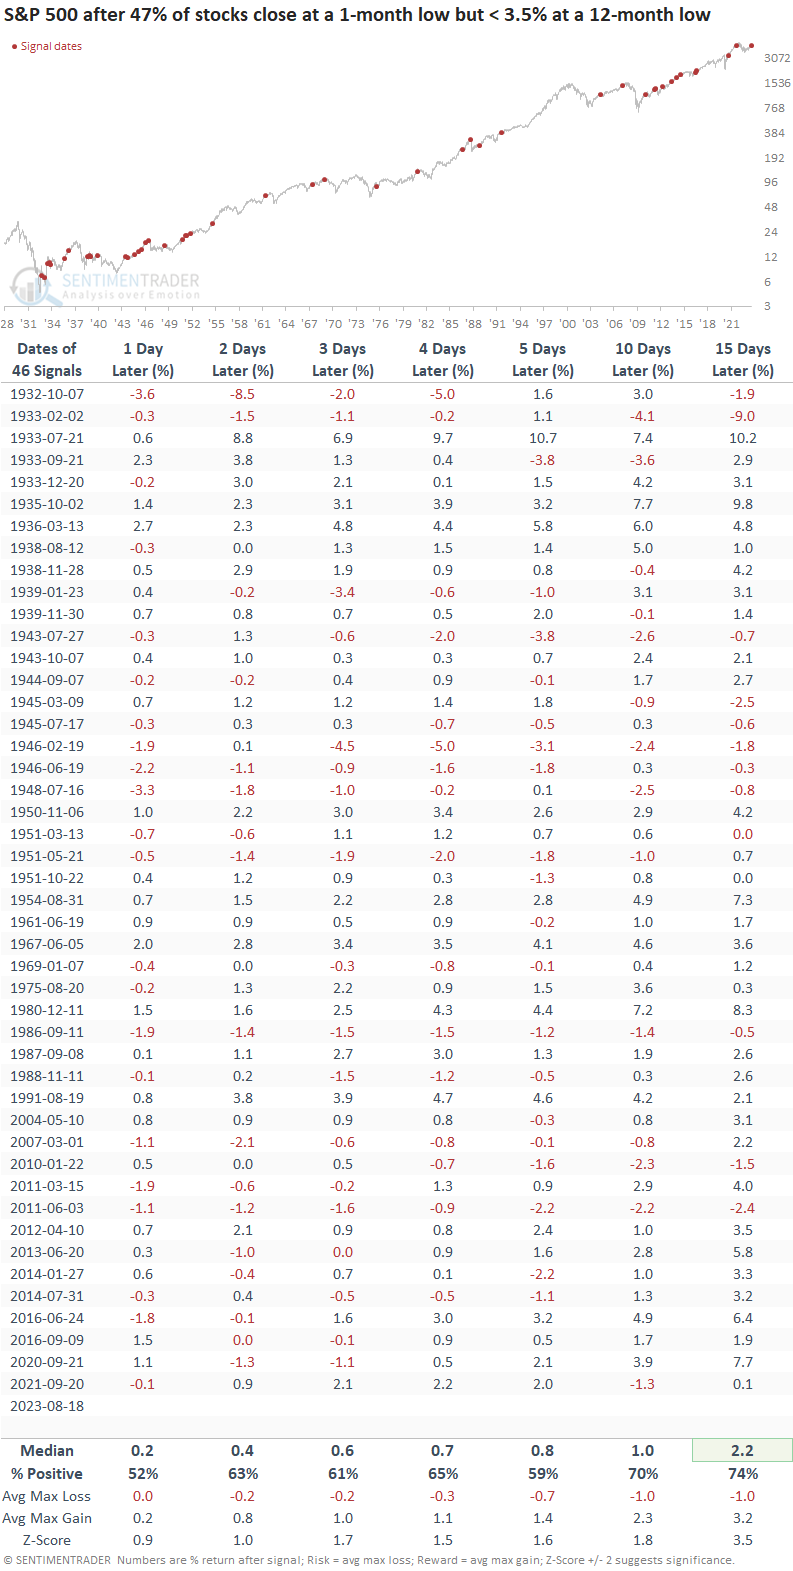
Let's assess the outlook for the S&P 500 when 1-month lows reach 47%, and 12-month lows are less than 3.5%. For additional context, I will require the S&P 500 to close above its 200-day moving average, similar to the current environment.
Similar spreads between one and twelve-month lows preceded positive returns
In precedents where 1-month lows climb to 47%, while fewer than 3.5% of these stocks register a 12-month low, the spread tends to mark an oversold condition in an uptrend. Three weeks later, the S&P 500 was higher 74% of the time, with a median return of 2.2%.
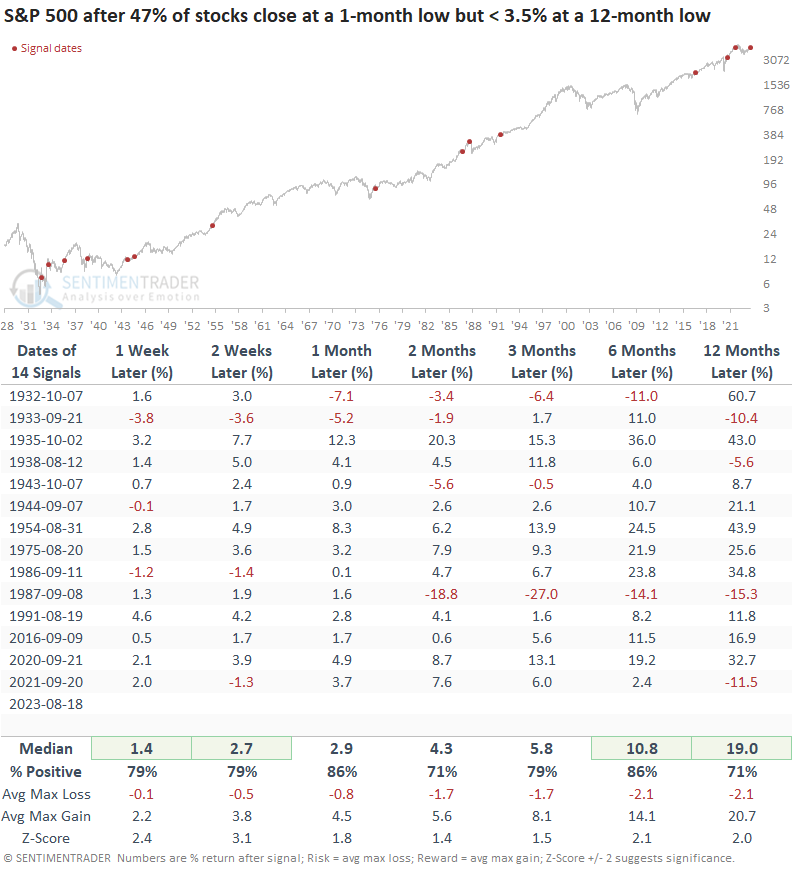
Results since 1950 are really impressive, with an 85% win rate over the next three weeks.
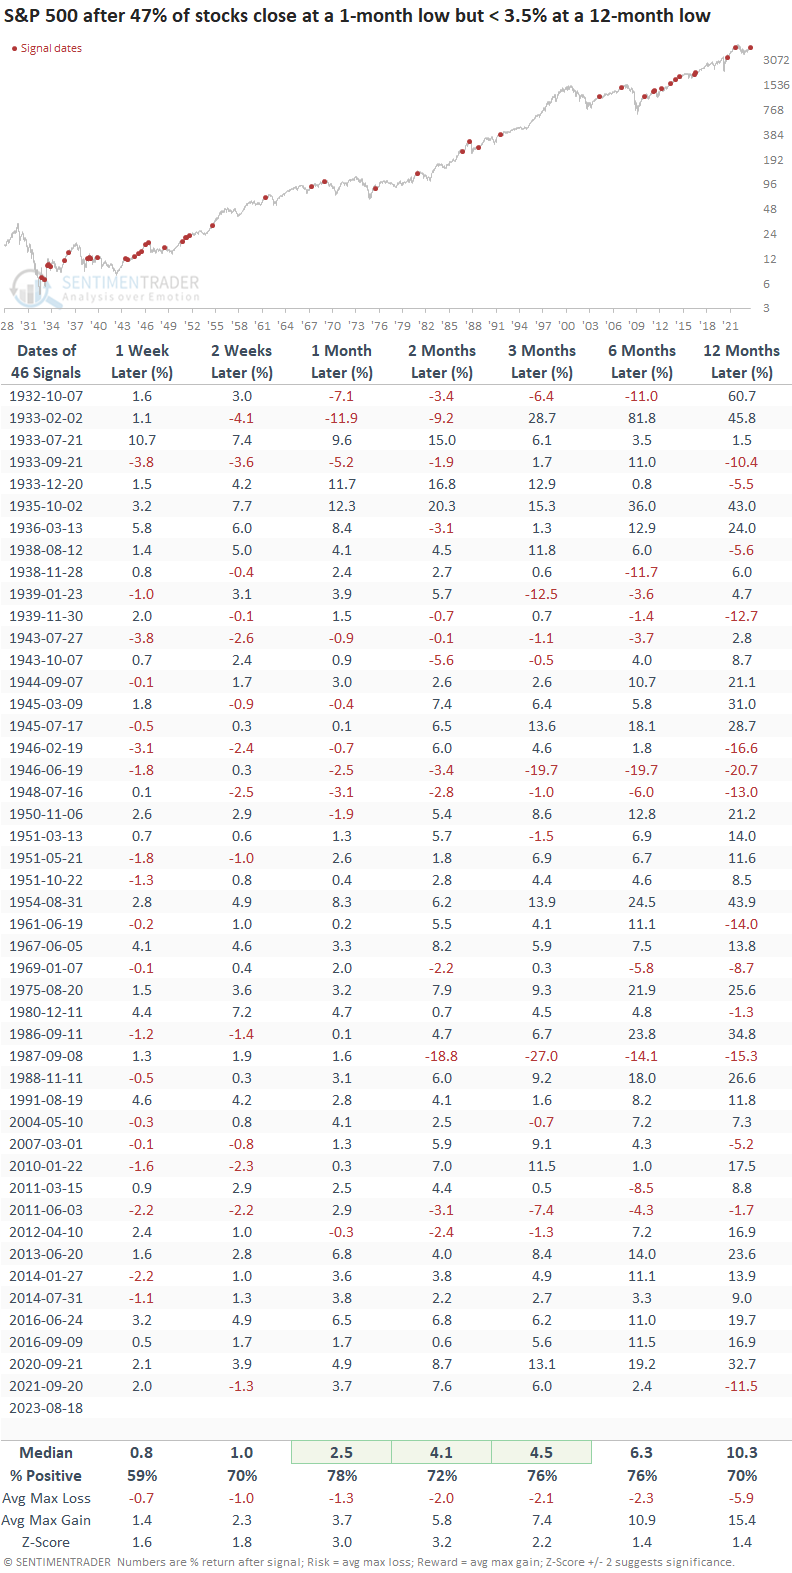
The case for an oversold condition that refreshes a bullish uptrend looks compelling over longer duration time frames, with excellent results ranging from one to twelve months later. Once again, results since 1950 were fantastic, with the large-cap index rising 93% of the time over the next month.
Seasonality
My colleague, Jay Kaeppel, published a note on S&P 500 seasonality today. Suppose I isolate instances that occurred during the seasonally weak period for stocks. In that case, the S&P 500 was higher 86% of the time over the subsequent one and six months.
It's worth mentioning that most signals occurred when the seasonal window was nearing its conclusion rather than at the initial stages.
What the research tells us...
With the S&P 500 closing down in 11 out of 14 trading sessions from a 52-week high, short-term market breadth indicators like 1-month month lows show signs of capitulation. Similar increases in 1-month lows for S&P 500 stocks when 12-month lows remain contained tend to denote the end of a corrective phase in a bullish uptrend. However, one cannot rule out a choppy environment with the bulk of the seasonally weak period ahead. As always, additional supporting evidence of an oversold market should help catalyze a year-end rally.