
A bullish increase in new highs for the homebuilding industry

Key points:
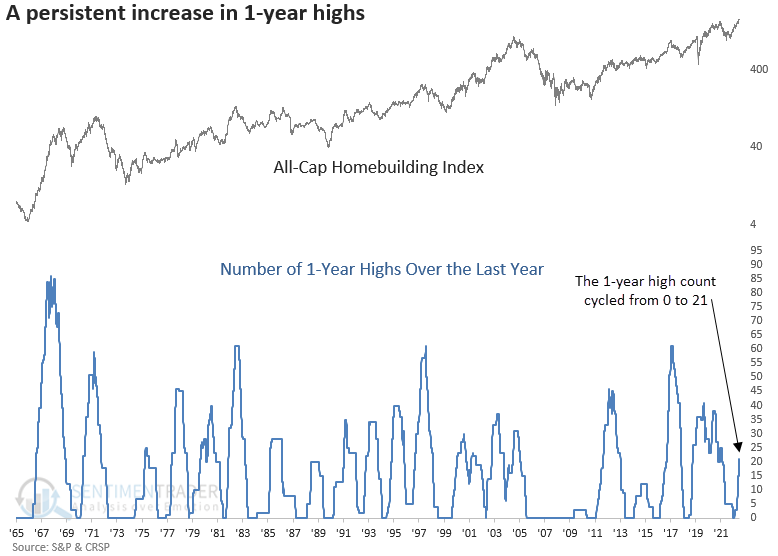
- Over the last year, homebuilders have achieved a 1-year high on 21 occasions
- The persistent increase in new highs occurred after the industry failed to record a single high
- Comparable increases in annual highs resulted in positive returns for homebuilders and the S&P 500
A bullish number of annual highs for an interest rate-sensitive industry
In a research note in January, I shared a trend-following buy signal for the homebuilding industry with a 100% win rate over the next three months. I'm happy to report that since the publish date, the builders are up 21.68%, adding to the undefeated record and far outpacing the 7.66% gain in the S&P 500.
With significantly better-than-expected housing starts and permits data released on Tuesday, I decided to check in on the homebuilders to see if we should continue to ride the winning streak.
While reviewing the data, I noticed a substantial rise in 1-year highs starting in April. When I computed the total count over the last year, it hit 21 on Tuesday.
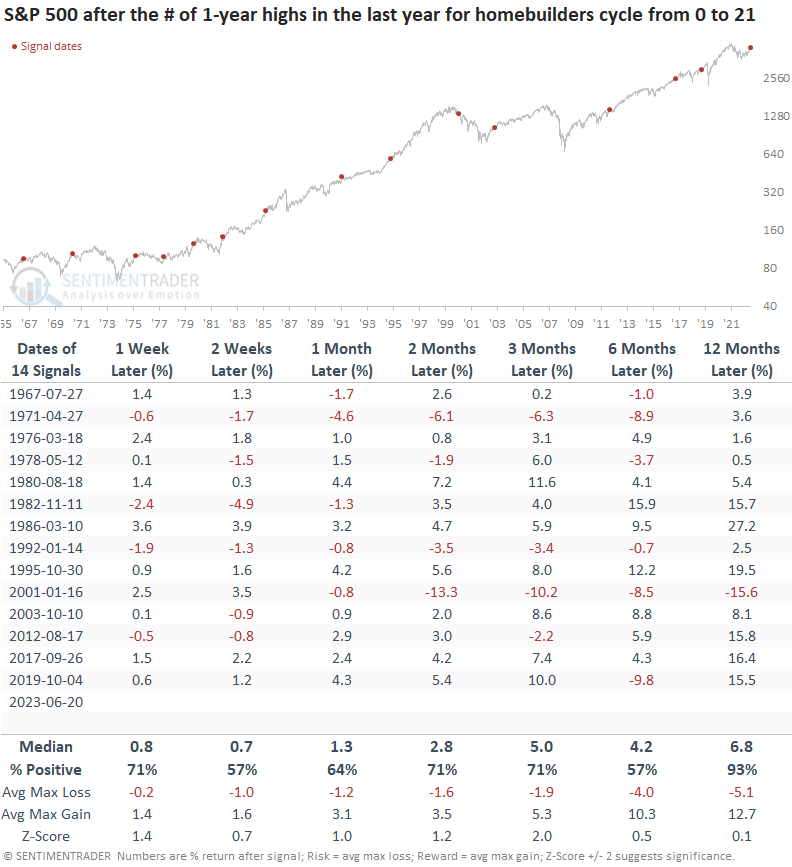
Let's assess the outlook for homebuilders and the S&P 500 when the 1-year high count over the last year cycles from 0 to 21.
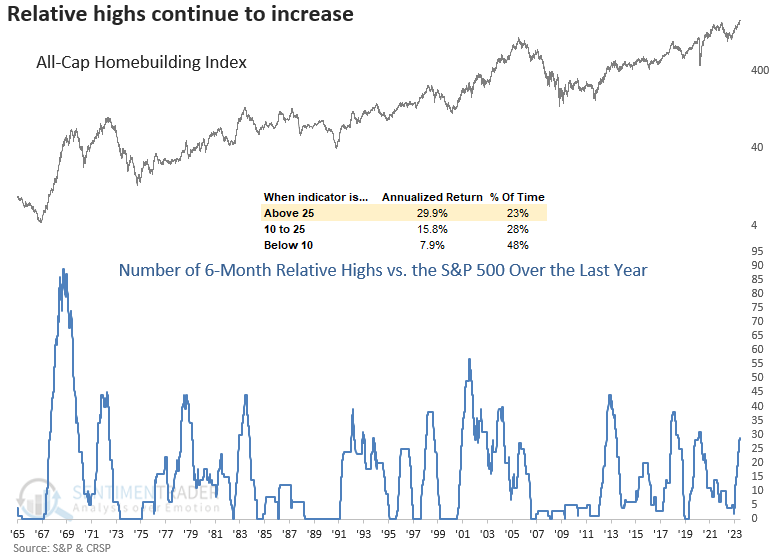
If we look at 6-month relative highs, my preferred time frame for relative comparisons, the homebuilders have recorded 29 highs in the last year. The industry annualizes at almost 30% when the count exceeds 25.
Similar persistent increases in 1-year highs preceded positive returns
When the 1-year high count for the homebuilding sub-industry group cycles from 0 to 21, the favorable industry momentum will likely continue, especially up to three months later. Over that same period, the builders were higher at some point in all but one case. A year later, the group was higher 86% of the time, with only one significant loss.
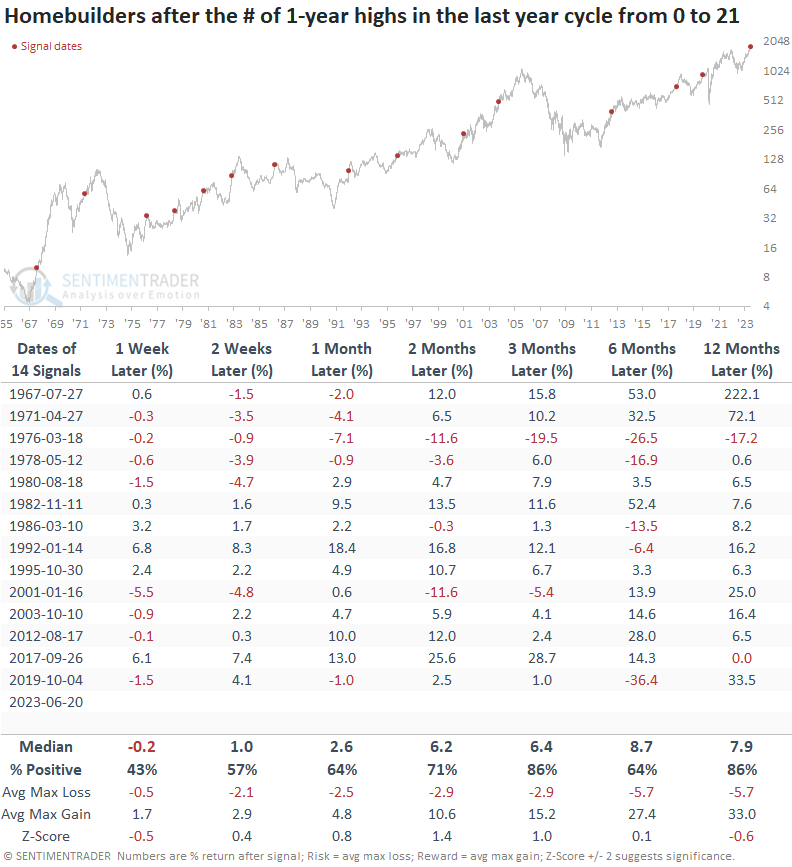
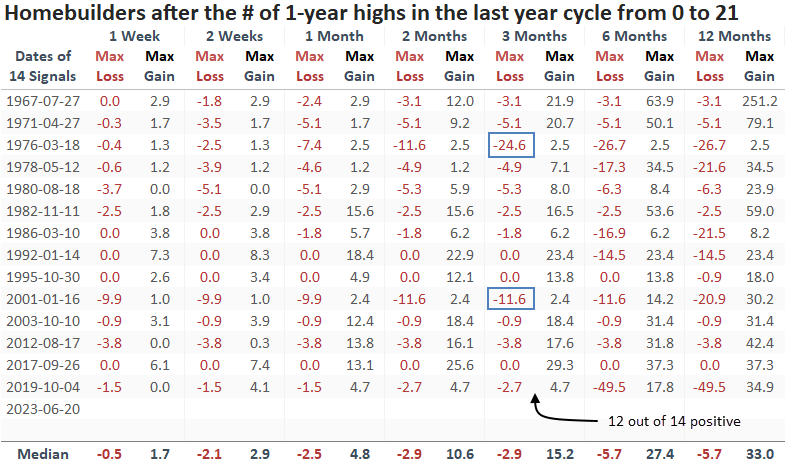
Over the next three months, the max gain exceeded the max loss in 12 out of 14 precedents.
Broad market performance
The S&P 500 tends to trend upward when homebuilders register a significant number of 1-year highs, just as they are now. Except for one instance, the large-cap index increased a year later. The lone exception occurred during the 2000-02 bear market when housing was a bright spot in a generally soft economy.
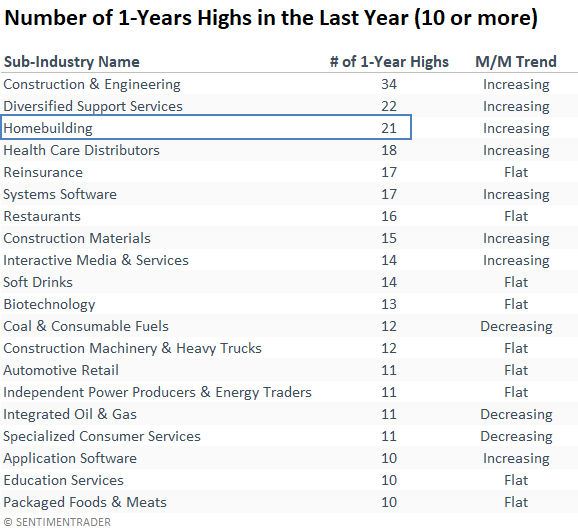
Other groups with a high number of 1-year highs
When I examine sub-industry groups with ten or more 1-year highs in the last year, the table contains several groups outside the Technology sector. So, despite what we see in the headlines, other opportunities exist.
Given an absence of 1-year highs from housing-related groups, the standalone strength in homebuilding is somewhat unusual. In a traditional housing cycle, you would see a rising tide that lifts all boats.
What the research tells us...
Homebuilders have demonstrated unwavering strength and resilience, propelling the industry to a significant number of 1-year highs over the last year after a period where it failed to achieve a single high. Similar increases in annual highs resulted in positive returns for homebuilders and the S&P 500 over the next year. So, despite excellent year-to-date performance and new high after new high, the bullish momentum can continue.