
A bullish expansion in new highs for the Financials sector

Key points:
- More than 45% of S&P 500 Financial sector stocks registered a 52-week high
- Comparable surges in new highs with the sector at a 5-year high preceded a bullish outlook for Financials
- What's good for Financials is good for the broad market, with the S&P 500 rising 85% of the time a year later
Financials provide additional clarity on the sustainability of the uptrend
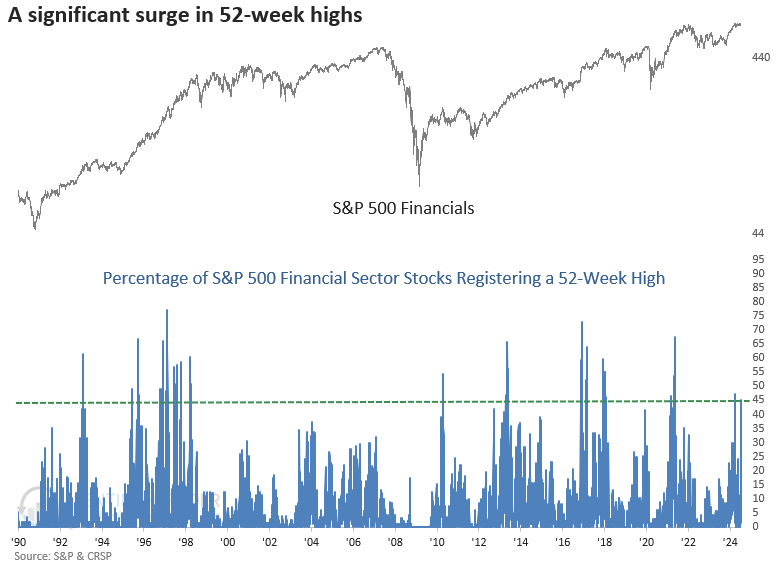
In my latest research note, I highlighted a substantial rise in 21-day highs among small-cap stocks, primarily driven by breakouts in the financial sector. This trend was not exclusive to small-caps, with large-cap financials also displaying a significant surge in new highs, especially relative to other groups.
On Tuesday, more than 45% of S&P 500 Financial sector stocks hit a 52-week high, outpacing the next best sector, Communication Services, which reached 27% and more than doubling the S&P 500's reading of 18%.
Financials are a systemically important sector that typically provides a warning in advance of significant market peaks. Therefore, with 52-week highs increasing, the stock market is less likely to be on the brink of a credit-driven risk-off period.
Comparable surges in 52-week highs preceded positive returns
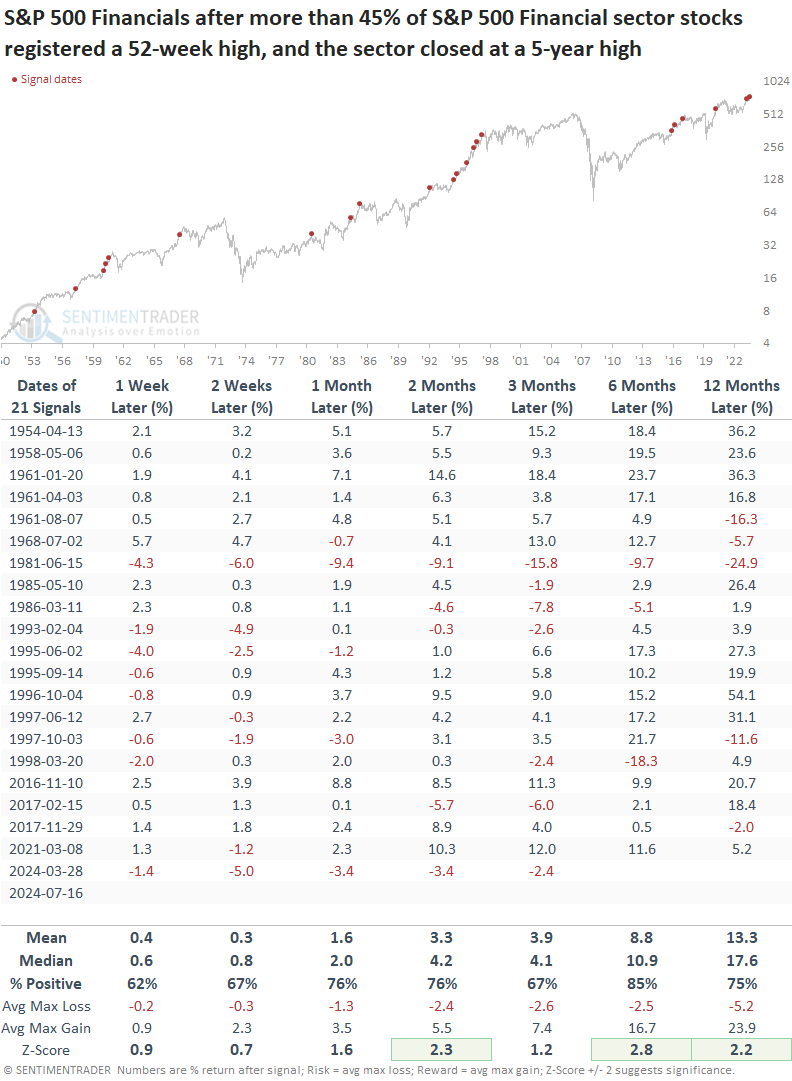
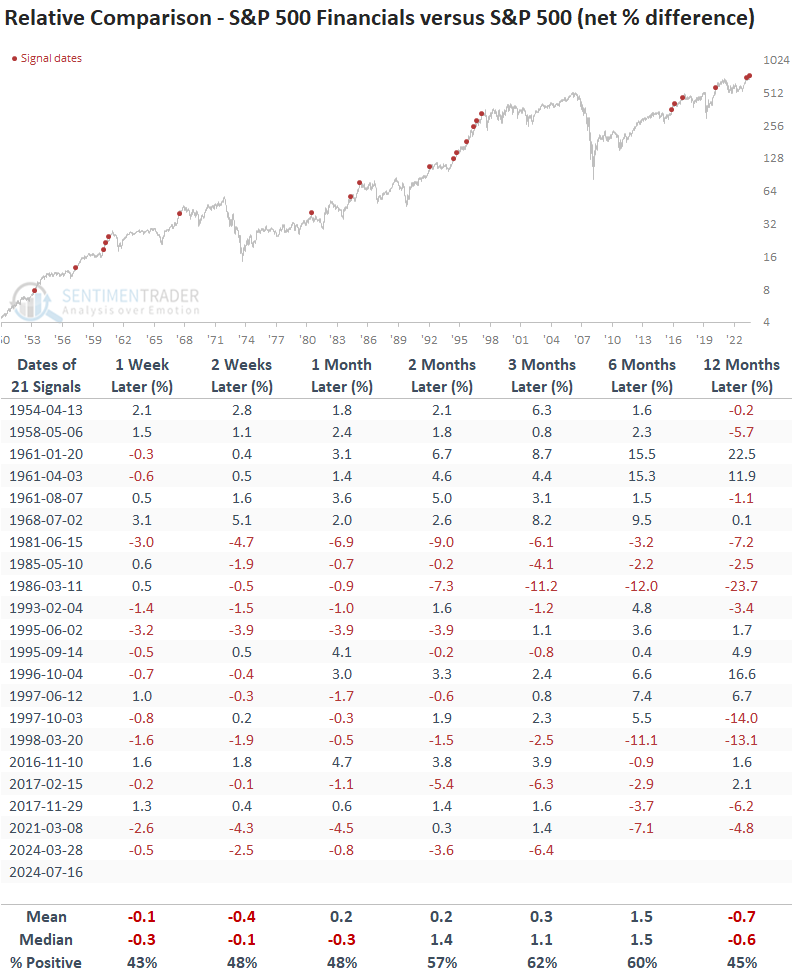
Following precedents when more than 45% of S&P 500 Financial sector stocks registered a 52-week high as the sector closed at a 5-year high, the S&P 500 Financials displayed solid returns and consistency, especially over a medium to long-term horizon where several time frames showed significance relative to random returns.
The only time an expansion in new highs coincided with an immediate peak in the sector occurred in June 1981. If you recall, this was during the 1980-82 bear market when the energy sector (the largest group by market cap) dragged the S&P 500 lower, as most other groups acted reasonably well.
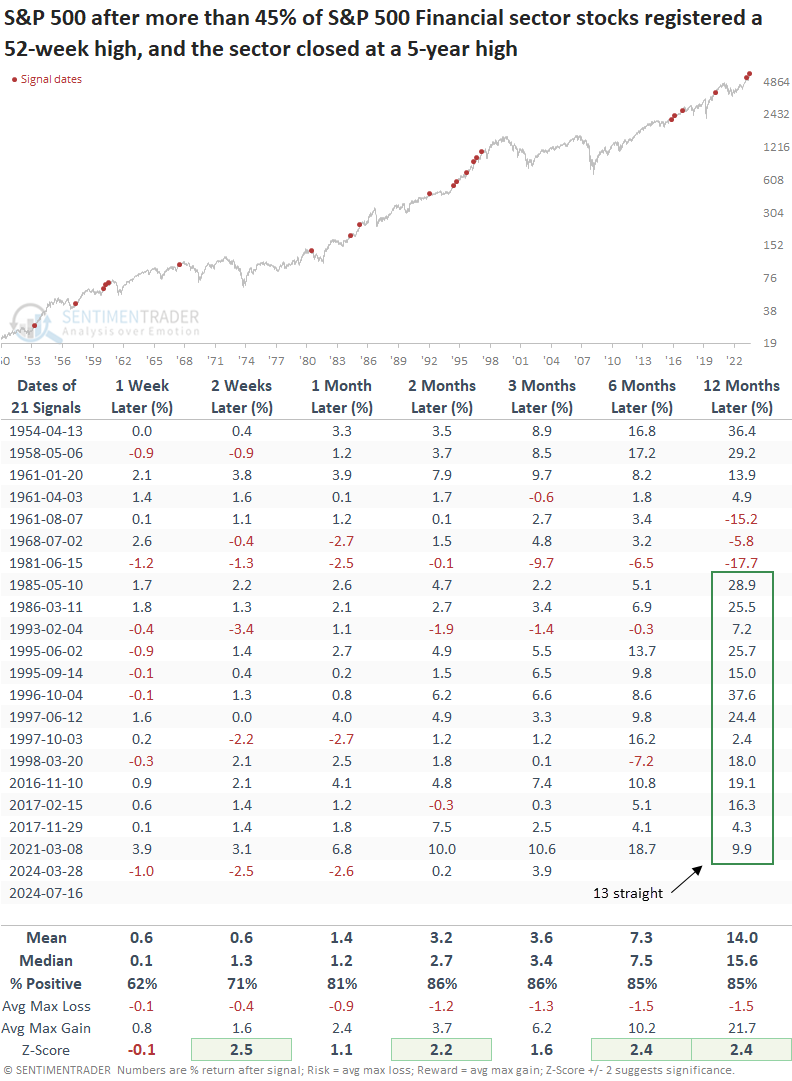
When 52-week highs for financial sector stocks surge, like now, the S&P 500's returns and consistency were outstanding over the following year, with several time frames exhibiting significance relative to random returns over the study period.
Impressively, the world's most benchmarked index has achieved gains a year later for 13 straight instances, with the last negative return dating back to 1981.
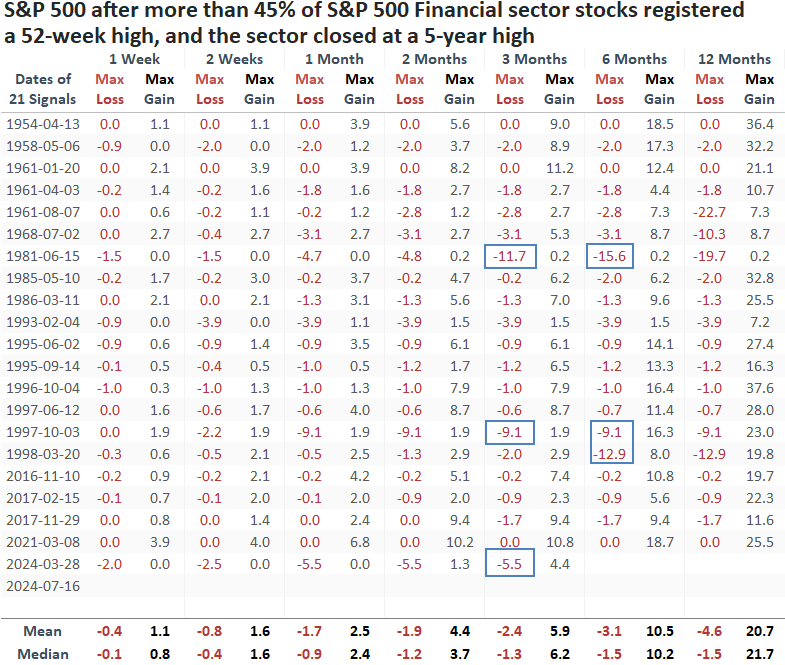
Over the subsequent three and six months, the maximum loss surpassed -5% on only three occasions, indicating that a meaningful drawdown is less likely when a significant number of Financial sector stocks have surged to 52-week highs.
Relative perspective
Following similar precedents, the S&P 500 Financials tended to struggle compared to the S&P 500 over the ensuing month. Since 1981, the tendency has been even more pronounced, with the group underperforming the S&P 500 at some point in 13 out of 15 cases.
Once Financials settled in, they outperformed from two to six months later.
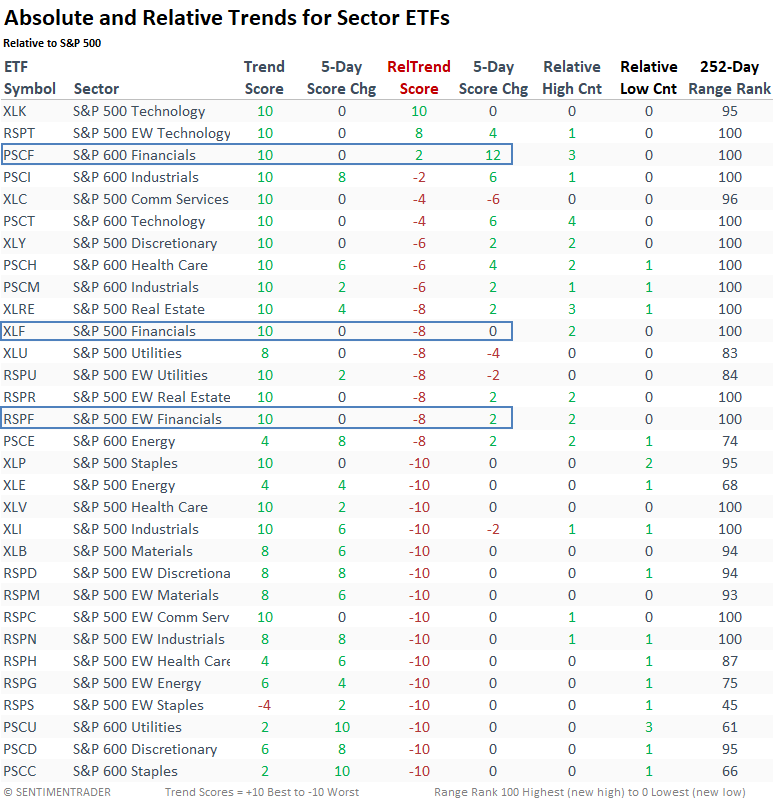
Relative trends
Despite a bullish outlook for Financials following a surge in 52-week highs, current relative trend score rankings, which use medium to long-term indicators, do not reflect a scenario suggesting investors should be overweight the group at this time. Therefore, I would selectively favor individual stocks with strong absolute and relative trends.
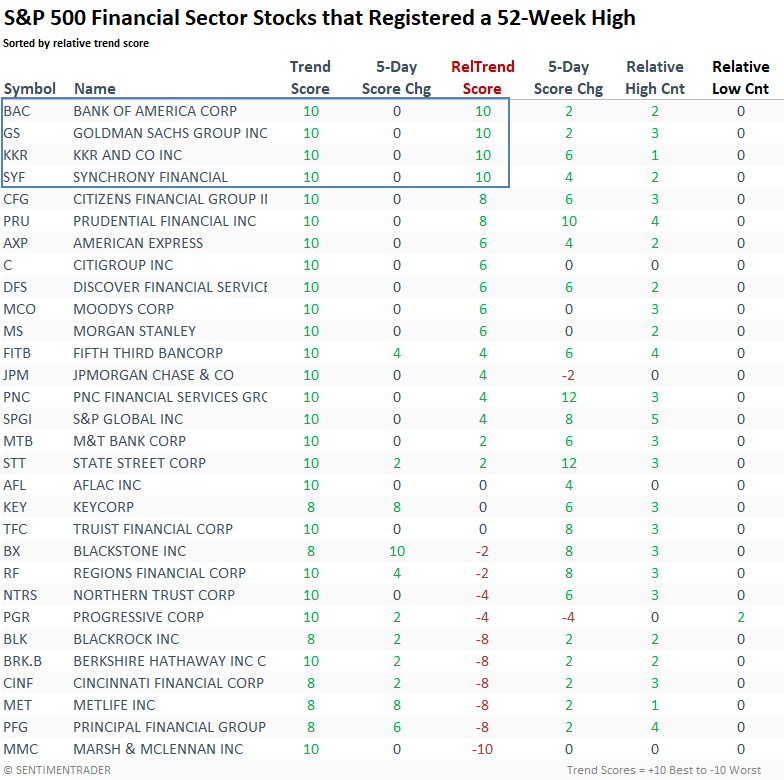
52-week highs list for S&P 500 Financials
Financial sector stocks that registered 52-week highs and exhibit favorable trend scores include Bank of America, Goldman Sachs, KKR & Co, and Synchrony Financial, to name a few.
What the research tells us...
More than 45% of S&P 500 Financial sector stocks registered a 52-week high as the sector closed at a 5-year high, indicating a broadening in participation from a systemically important group. Following similar expansions in new highs, the Financials and the S&P 500 displayed excellent returns and consistency over the subsequent year. While broadening participation is a positive development, it doesn't necessarily mean a change in leadership. While improving, relative trends for the sector remain unattractive, suggesting the group lacks a tailwind. Therefore, investors should strategically allocate to individual stocks exhibiting solid absolute and relative trends.