Products
SentimenTrader Trading Tools
‍
Backtest Engine
My Trading Toolkit
Correlation Analysis
Seasonality
Market Prediction
Indicators & Data API
‍
Proprietary Indicators & Charts
Market Data API
Strategies & Scanner
‍
50+ Trading Strategies
Smart Stock Scanner
Smart Option Scanner
Research Reports
‍
Research Solutions
Reports Library
Free Resources
Simple Backtest Calculator
Simple Seasonality Calculator
The Kelly Criterion Calculator
Sentiment Geo Map
Public Research Reports
Education
Sentiment Indicators
Technical Indicators
Pricing
Company
About
In the News
Testimonials
Client Success Stories
Contact
Log inLoginSign up
< BACK TO ALL REPORTS

A bullish expansion in new highs for NYSE issues

Dean Christians
2023-12-11
The spread between 52-week highs and lows on the NYSE expanded in favor of highs, generating a buy signal for stocks. Similar alerts led to bullish outcomes for the S&P 500 over the subsequent six and twelve months.

Key points:

  • The spread between 52-week highs and lows on the NYSE shifted to a favorable profile
  • Annual highs outpacing annual lows is indicative of a bullish stock market backdrop
  • Several indexes triggered buy signals when their respective spreads turned positive

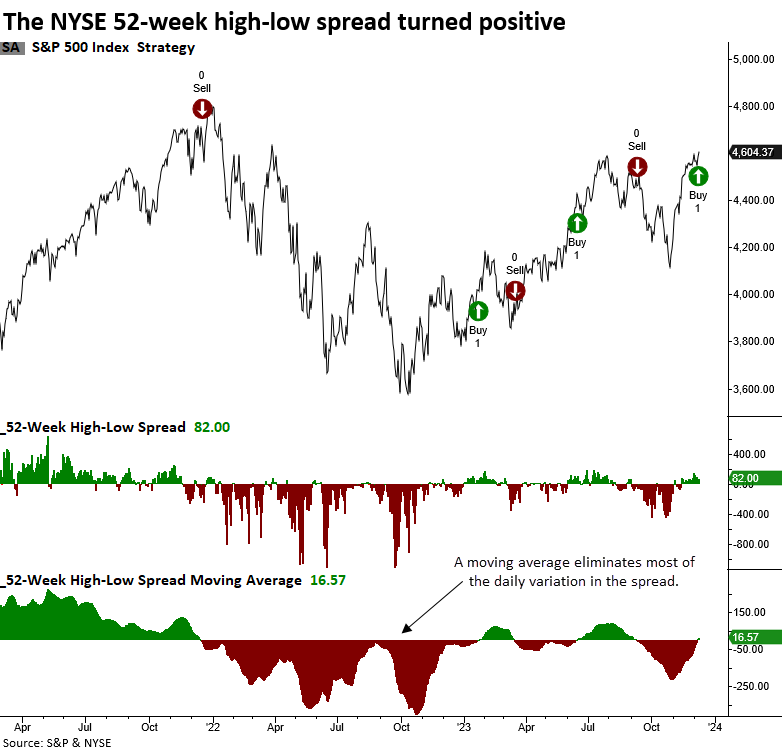
The 52-week high-low spread signals an advantageous environment for stocks

Monitoring the difference between 52-week highs and lows is a frequently observed and critical indicator for assessing market breadth, making it an integral part of my breadth composites. Yet, when employed as an individual measure, I find it beneficial to apply a moving average to temper the fluctuations in the spread.

Last week, the 30-day moving average for the spread between 52-week highs and lows on the NYSE crossed above zero, generating a bullish market breadth signal.

With the NYSE exchange joining several indexes on a 52-week high-low spread buy signal, the weight of the evidence continues to support a bullish backdrop for stocks. 

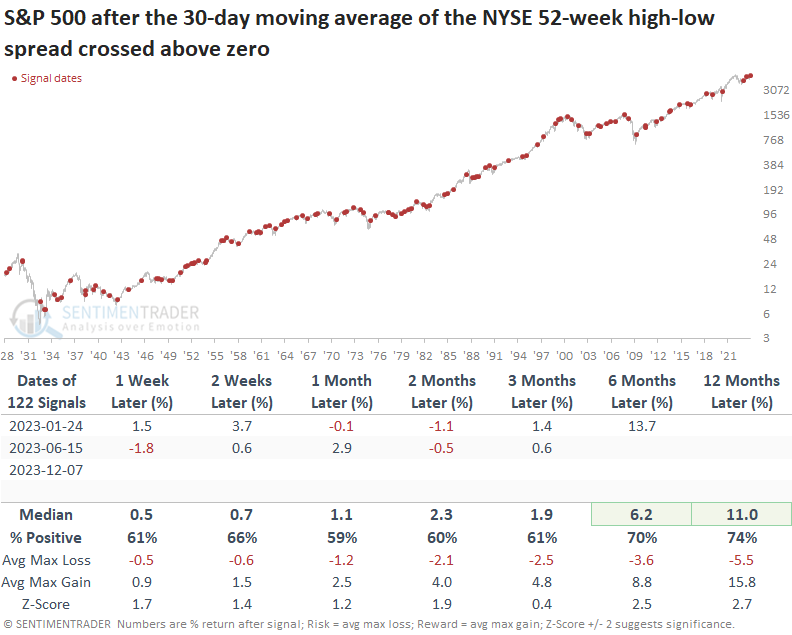
Similar 52-week high-low spread signals were indicative of a bullish backdrop

Whenever the 30-day moving average spread between 52-week highs and lows on the NYSE rose above zero, the median return for the S&P 500 exceeded the median return over the study period across all time horizons. 

The results over the six- and twelve-month periods were especially favorable, suggesting a trend environment more indicative of bull than bear markets. 

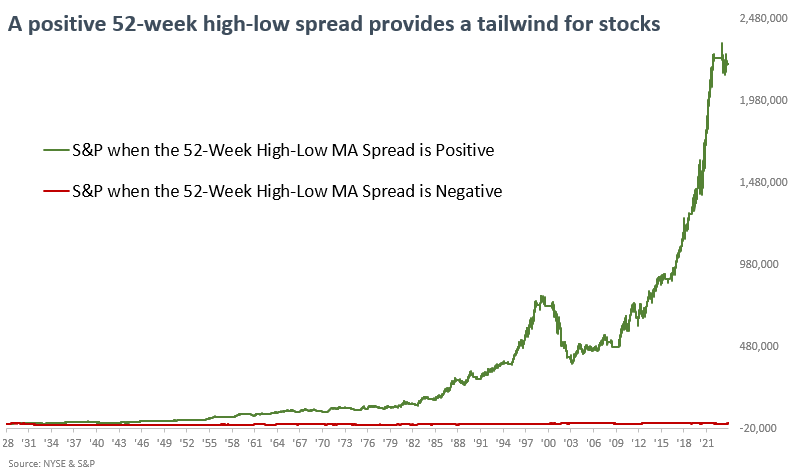
The 52-week high-low spread indicator as a risk-on or risk-off system 

The system generates a buy signal when the 30-day moving average for the 52-week high-low spread exceeds zero. Conversely, the model registers a sell signal when the indicator falls below zero.

Except for the Dotcom bust, the NYSE 52-week high-low spread equity curve has historically demonstrated a consistent upward path with limited drawdowns. 

The 2000-02 period was unusual in that NYSE 52-week highs expanded relative to lows for most of the bear market as Technology stocks negatively impacted the S&P 500. 

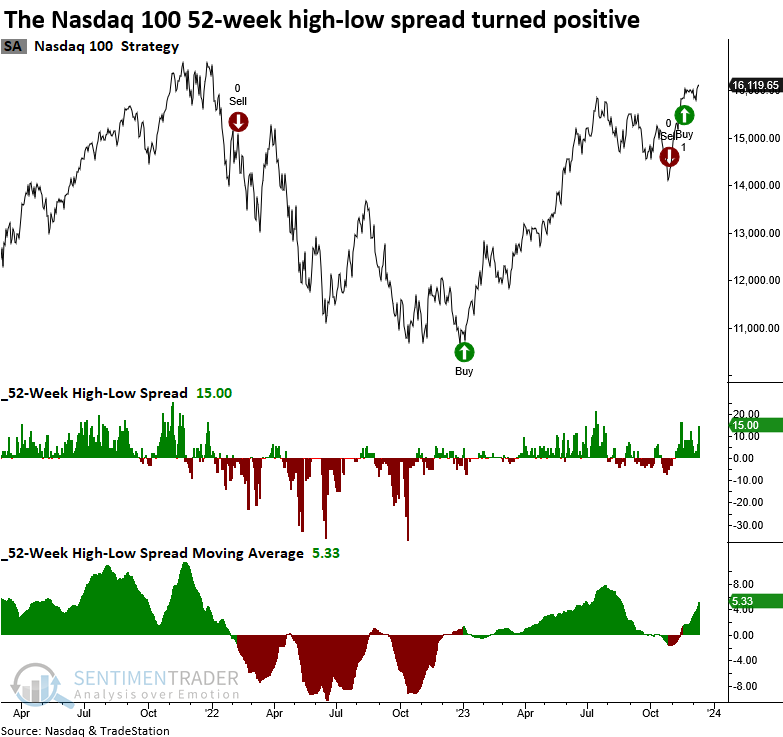
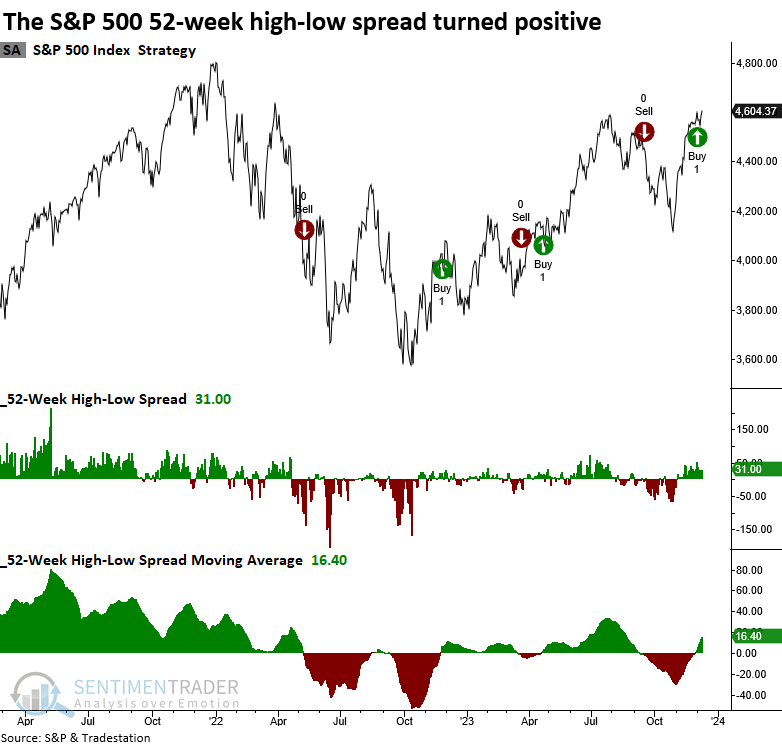
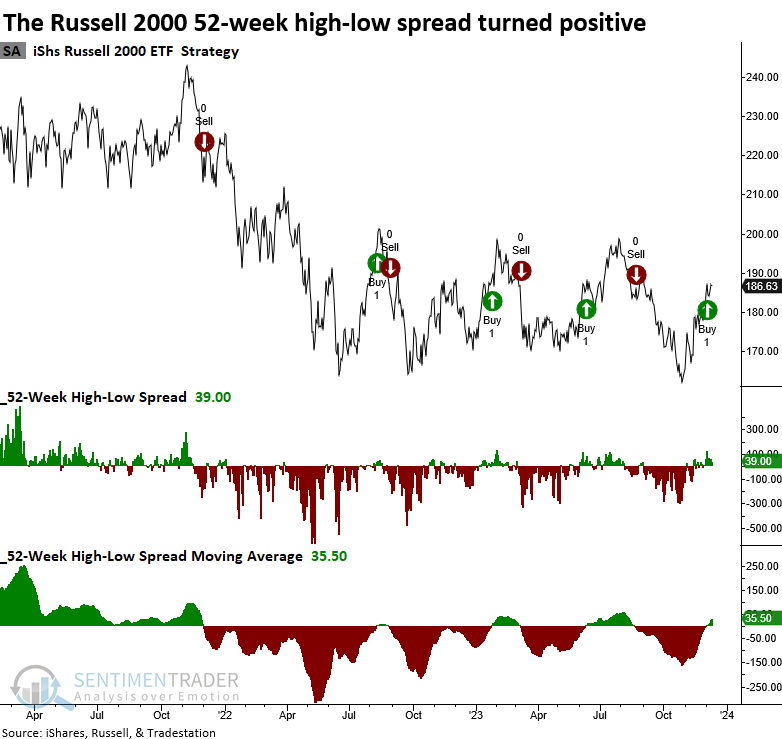
Signals triggered across a broad and diverse group of stocks

The 52-week high-low system can be applied to any exchange or index data series. However, I use slightly different parameters for the moving average and buy/sell thresholds. 

The S&P 500 generated its third buy signal since the market low in October 2022. 

The erratic price movements witnessed in the Russell 2000 over the past few years have posed a formidable challenge for a system such as this.

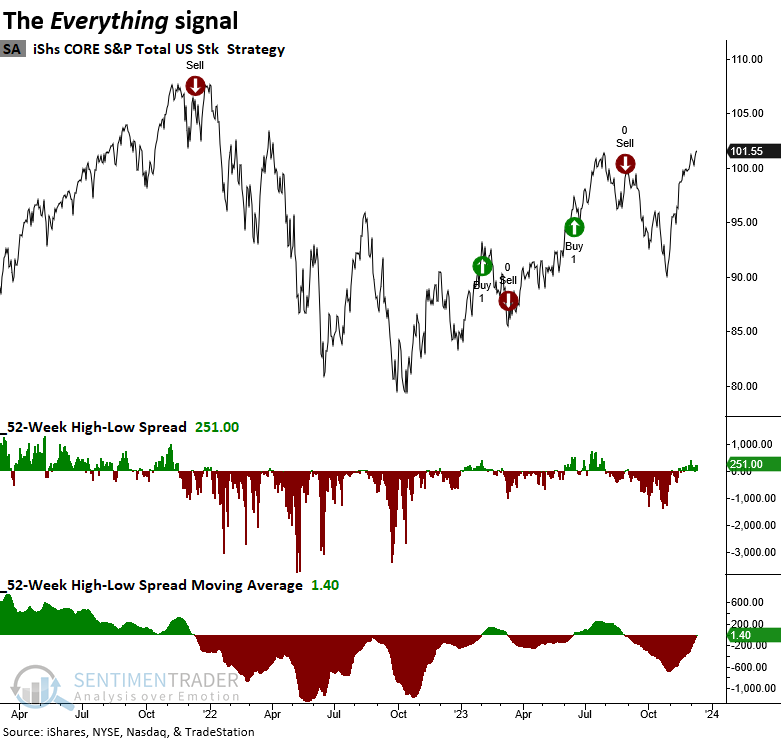
This chart contains the 52-week high-low spread for over 9,000 securities listed on all exchanges in the U.S. Today's shift to positive territory will trigger a new buy signal at the close of trading.

What the research tells us...

Situational awareness is a term that refers to a trader's ability to understand and interpret the current market conditions. By having a solid grasp on the general market backdrop, a trader is better equipped to make more informed decisions and adjust their portfolio exposure levels in response to changing market dynamics. The current prevalence of 52-week highs over lows on the NYSE and various indexes creates an advantageous climate for stock traders. That's especially the case for swing or breakout traders, as they have a tailwind at their back.

PRODUCTS
SentimenTrader
Trading Tools
Indicators & Data API
‍
Strategies & Scanner
‍
Research Reports
FREE
RESOUrCES
Simple Backtest
Calculator
Simple Seasonality
Calculator
The Kelly Criterion
Calculator
Sentiment Geo Map
‍
Public Research Reports
‍
Education
Sentiment Indicators
‍
Technical Indicators
‍
Pricing
Bundle pricing
‍
FAQ
‍
Announcements
‍
COMPANY
‍
About
‍
In the News
‍
Testimonials
‍
Client Success Stories
CONTACT
‍
General Inquiries
‍
Media Inquiries
‍
Financial Professionals Inquiries
‍
© 2026 Sundial Capital Research Inc. All rights reserved.
Setsail Marketing
TermsPrivacyAffiliate Program
Risk Disclosure: The information and tools provided are for research and analytical purposes only and are not intended as investment advice. Market analysis involves uncertainty, and outcomes may differ from expectations. Users should conduct their own due diligence and consider their individual circumstances before making any financial decisions. Past performance is not necessarily indicative of future results.

Hypothetical Performance Disclosure: Hypothetical performance results have many inherent limitations, some of which are described below. No representation is being made that any account will or is likely to achieve profits or losses similar to those shown; in fact, there are frequently sharp differences between hypothetical performance results and the actual results subsequently achieved by any particular trading program. One of the limitations of hypothetical performance results is that they are generally prepared with the benefit of hindsight. In addition, hypothetical trading does not involve financial risk, and no hypothetical trading record can completely account for the impact of financial risk of actual trading. for example, the ability to withstand losses or to adhere to a particular trading program in spite of trading losses are material points which can also adversely affect actual trading results. There are numerous other factors related to the markets in general or to the implementation of any specific trading program which cannot be fully accounted for in the preparation of hypothetical performance results and all which can adversely affect trading results.

Testimonial Disclosure: Testimonials appearing on this website may not be representative of other clients or customers and is not a guarantee of future performance or success.