Products
SentimenTrader Trading Tools
‍
Backtest Engine
My Trading Toolkit
Correlation Analysis
Seasonality
Market Prediction
Indicators & Data API
‍
Proprietary Indicators & Charts
Market Data API
Strategies & Scanner
‍
50+ Trading Strategies
Smart Stock Scanner
Smart Option Scanner
Research Reports
‍
Research Solutions
Reports Library
Free Resources
Simple Backtest Calculator
Simple Seasonality Calculator
The Kelly Criterion Calculator
Sentiment Geo Map
Public Research Reports
Education
Sentiment Indicators
Technical Indicators
Pricing
Company
About
In the News
Testimonials
Client Success Stories
Contact
Log inLoginSign up
< BACK TO ALL REPORTS

A bullish expansion in 1-year highs for Industrial sector stocks

Dean Christians
2023-06-20
The percentage of S&P 500 Industrial sector stocks closing at a 1-year high expanded above 23% to the highest level in a year. Similar expansions in new highs were bullish for Industrials and the S&P 500 over the following year.

Key points:

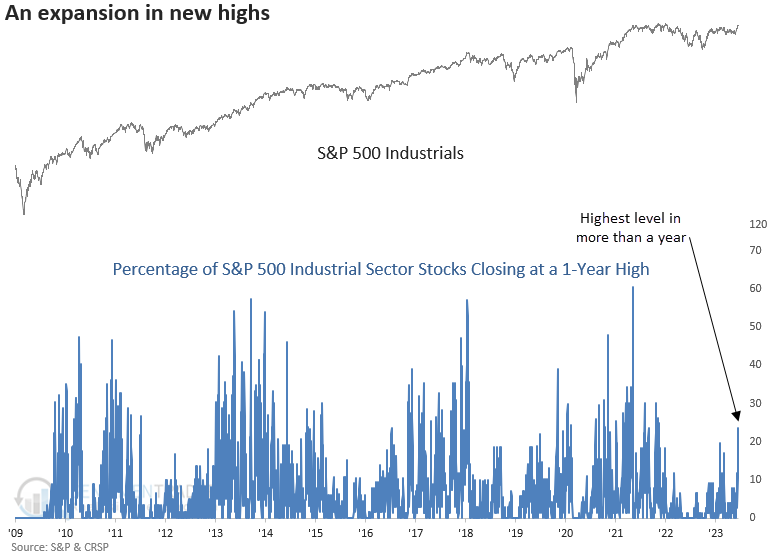
  • The percentage of S&P 500 Industrial sector stocks closing at a 1-year high exceeded 23%
  • Industrial sector new highs expanded to the highest level in more than a year
  • Following similar expansions in new highs, both industrials and the S&P 500 displayed solid results 

More and more large-cap Industrial stocks are breaking out to a 1-year high

The prevailing concern for most market participants has been the lack of broad-based participation from sectors beyond a handful of growth-oriented groups. As we highlighted in several notes, the participation problem eventually resolves itself with a catch-up trade that improves the internal condition of the market.

Nowhere is the improvement in breadth more evident than in large-cap Industrial stocks. On Friday, the percentage of S&P 500 Industrial sector stocks closing at a 1-year high expanded above 23% to the highest level in a year. And the overall level exceeded all other sectors, including Technology.

Typically, when a cyclical sector such as industrials gets in gear like now, it's a bullish development for the overall market.

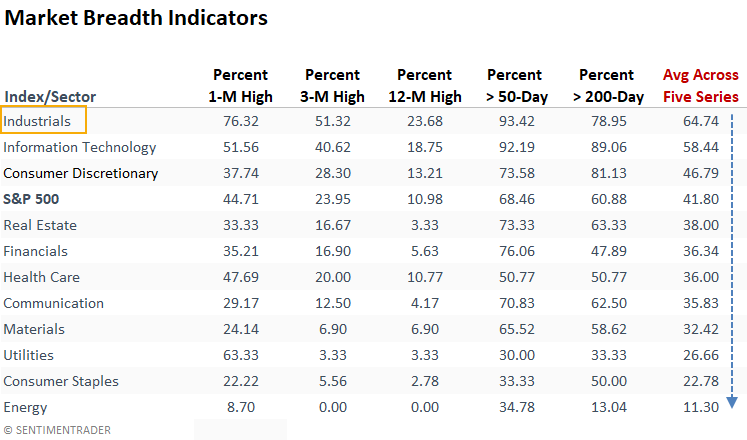
As of last Friday's closing bell, market breadth indicators for the S&P 500 Industrial sector looked the best of any group.

Similar expansions in new highs led to a positive outlook for the industrial sector

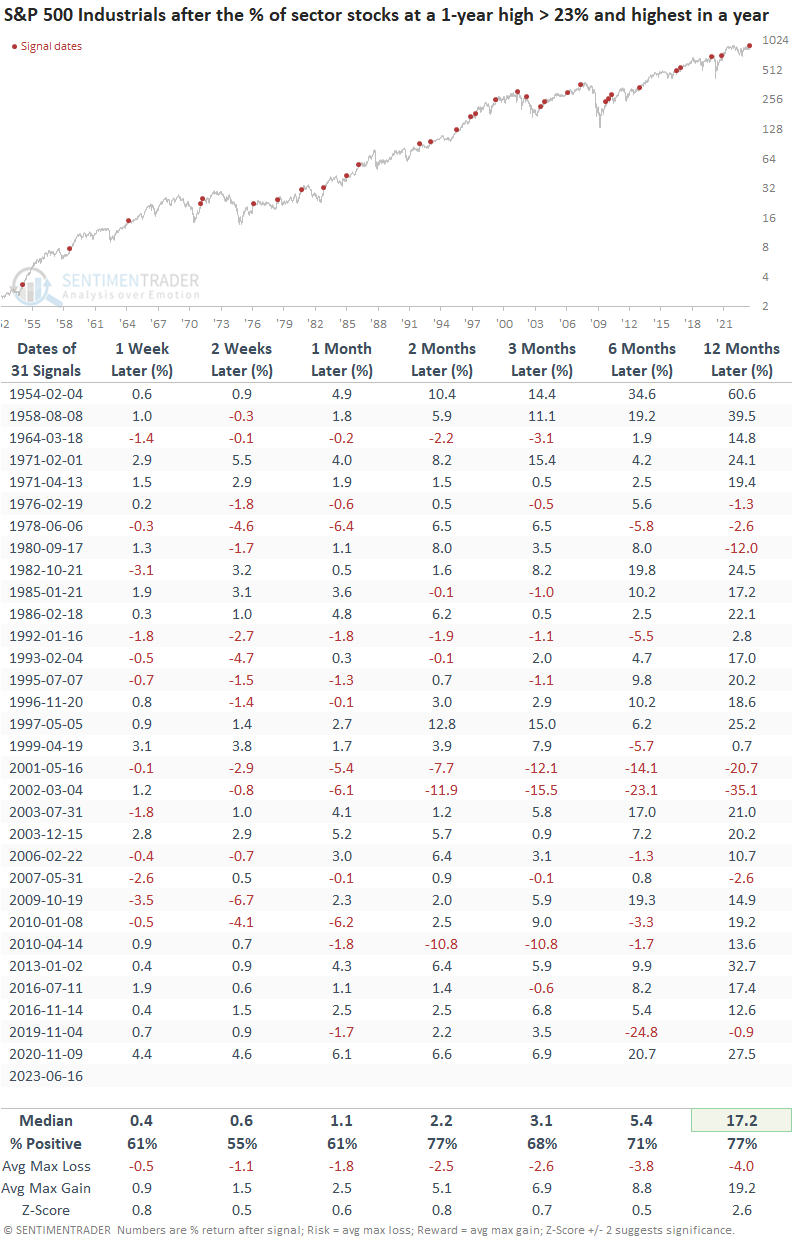
When the percentage of S&P 500 Industrial sector stocks closing at a 1-year high exceeds 23% and records the highest level achieved in the past year, the sector tends to rise over the subsequent year. The Dotcom bust was the lone period where the expansion in new highs yielded an unfavorable outlook for the subsequent year.

Broad market performance

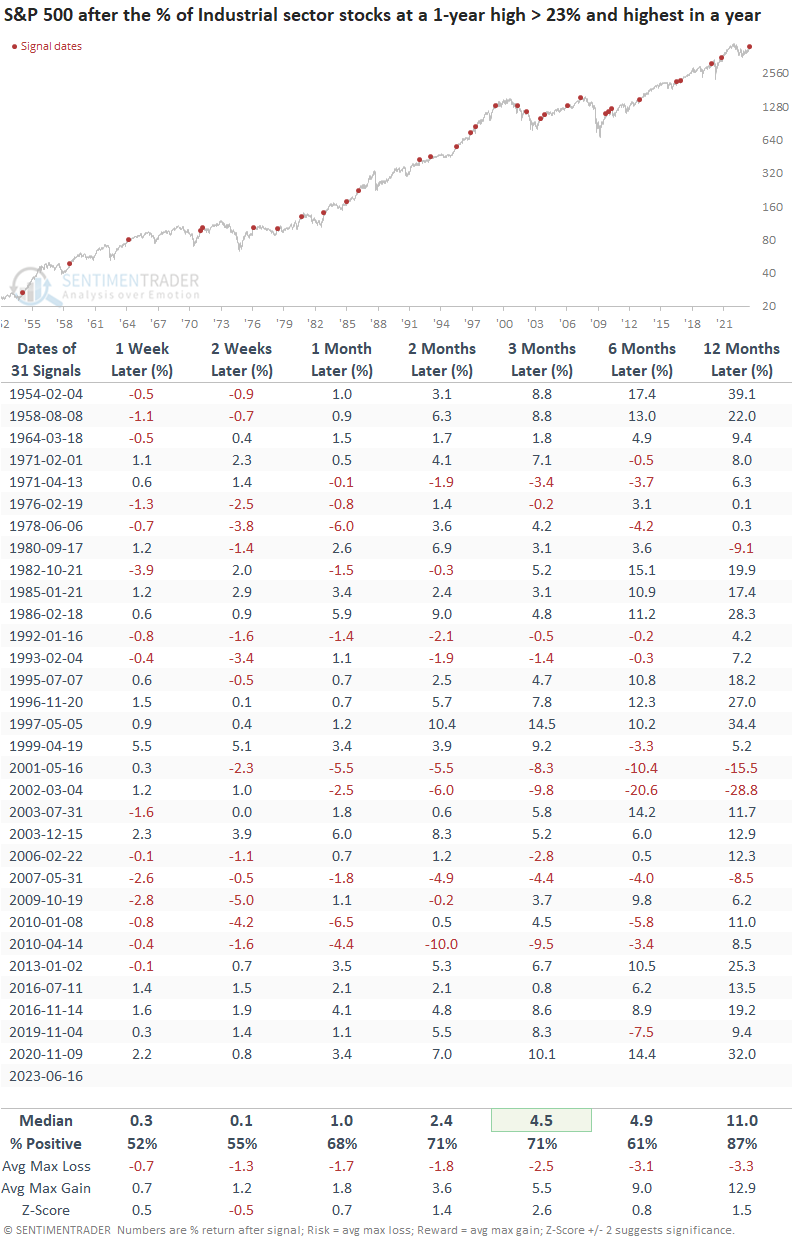
The S&P 500 shows a solid tendency to rally when the percentage of 1-year highs for S&P 500 Industrial sector stocks expand like now. Similar to the industrial sector outlook, the lone hiccup a year later occurred during the Dotcom bust.

What the research tells us...

Market breadth indicators for sectors outside of growth-oriented groups have significantly improved over the past few weeks. The industrial sector, in particular, has witnessed a remarkable surge, with 1-year highs soaring above 23% and reaching their highest point in over a year. This expansion in new highs suggests a positive outlook for both the industrial sector and the broad market. While anything can happen in the near term, the big-picture backdrop continues to favor the bulls.

PRODUCTS
SentimenTrader
Trading Tools
Indicators & Data API
‍
Strategies & Scanner
‍
Research Reports
FREE
RESOUrCES
Simple Backtest
Calculator
Simple Seasonality
Calculator
The Kelly Criterion
Calculator
Sentiment Geo Map
‍
Public Research Reports
‍
Education
Sentiment Indicators
‍
Technical Indicators
‍
Pricing
Bundle pricing
‍
FAQ
‍
Announcements
‍
COMPANY
‍
About
‍
In the News
‍
Testimonials
‍
Client Success Stories
CONTACT
‍
General Inquiries
‍
Media Inquiries
‍
Financial Professionals Inquiries
‍
© 2026 Sundial Capital Research Inc. All rights reserved.
Setsail Marketing
TermsPrivacyAffiliate Program
Risk Disclosure: The information and tools provided are for research and analytical purposes only and are not intended as investment advice. Market analysis involves uncertainty, and outcomes may differ from expectations. Users should conduct their own due diligence and consider their individual circumstances before making any financial decisions. Past performance is not necessarily indicative of future results.

Hypothetical Performance Disclosure: Hypothetical performance results have many inherent limitations, some of which are described below. No representation is being made that any account will or is likely to achieve profits or losses similar to those shown; in fact, there are frequently sharp differences between hypothetical performance results and the actual results subsequently achieved by any particular trading program. One of the limitations of hypothetical performance results is that they are generally prepared with the benefit of hindsight. In addition, hypothetical trading does not involve financial risk, and no hypothetical trading record can completely account for the impact of financial risk of actual trading. for example, the ability to withstand losses or to adhere to a particular trading program in spite of trading losses are material points which can also adversely affect actual trading results. There are numerous other factors related to the markets in general or to the implementation of any specific trading program which cannot be fully accounted for in the preparation of hypothetical performance results and all which can adversely affect trading results.

Testimonial Disclosure: Testimonials appearing on this website may not be representative of other clients or customers and is not a guarantee of future performance or success.