
A bullish cyclical sector relative strength backdrop

Key points:
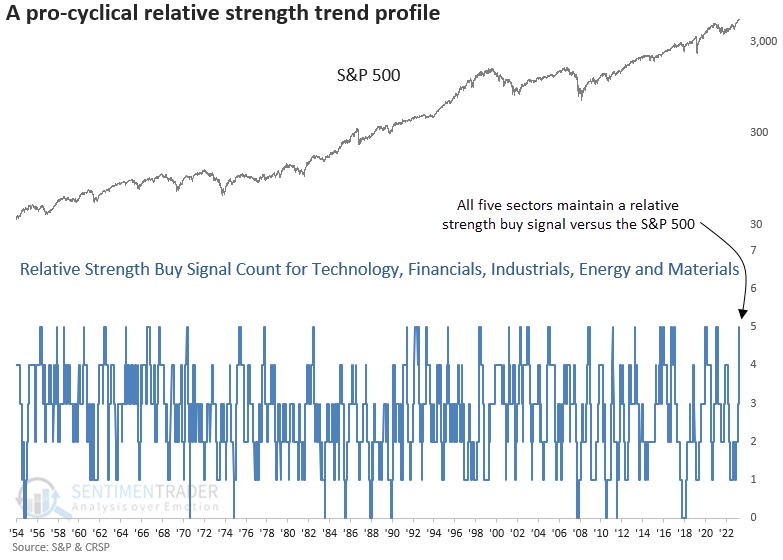
- Communication Services, Technology, Financials, Industrials, Energy, and Materials display positive trends
- When cyclical sectors exhibit bullish relative trends, the S&P 500 delivers impressive returns
- Economically sensitive sectors tended to outperform the S&P 500 over the subsequent year
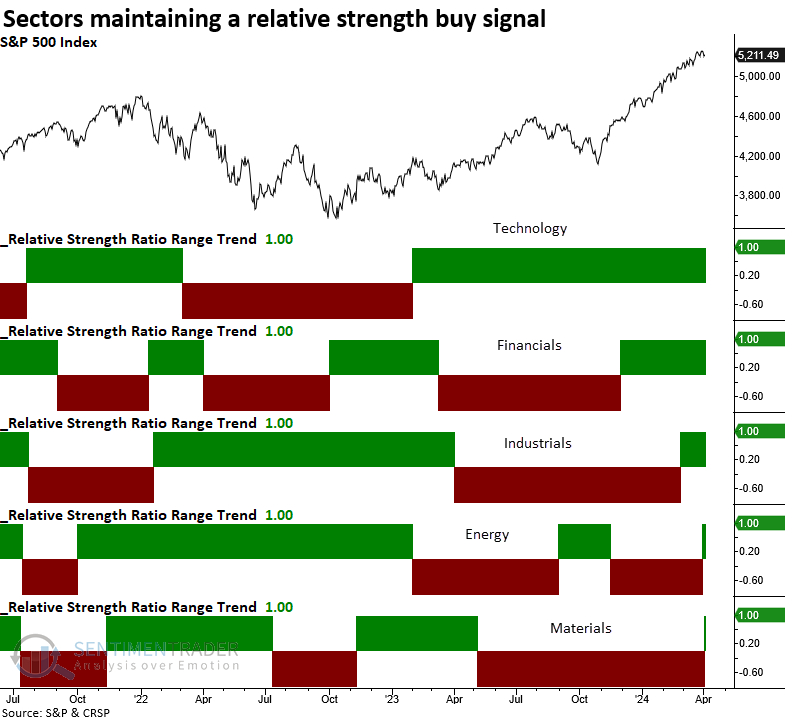
Economically sensitive sectors are displaying positive relative trends
On Wednesday, I published a research report highlighting a relative strength buy signal for the energy sector. One day later, Materials triggered an alert, bringing the number of groups on a buy signal to six. The sectors include Communication Services, Technology, Financials, Industrials, Energy, and Materials, collectively illustrating a relative trend profile marked by a pro-cyclical composition.
This cyclical sector alignment got me thinking: when have we seen this configuration in history, and what does it mean for the broad market and sectors?
I'll exclude communication services from the analysis because it underwent a substantial GICS restructuring in 2018, making a proper historical comparison more challenging.
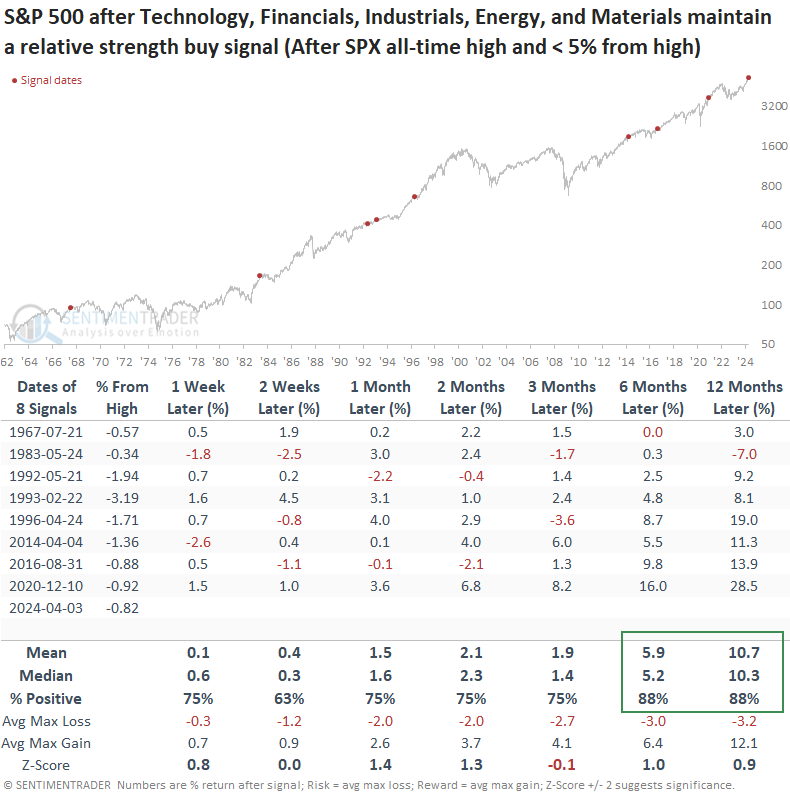
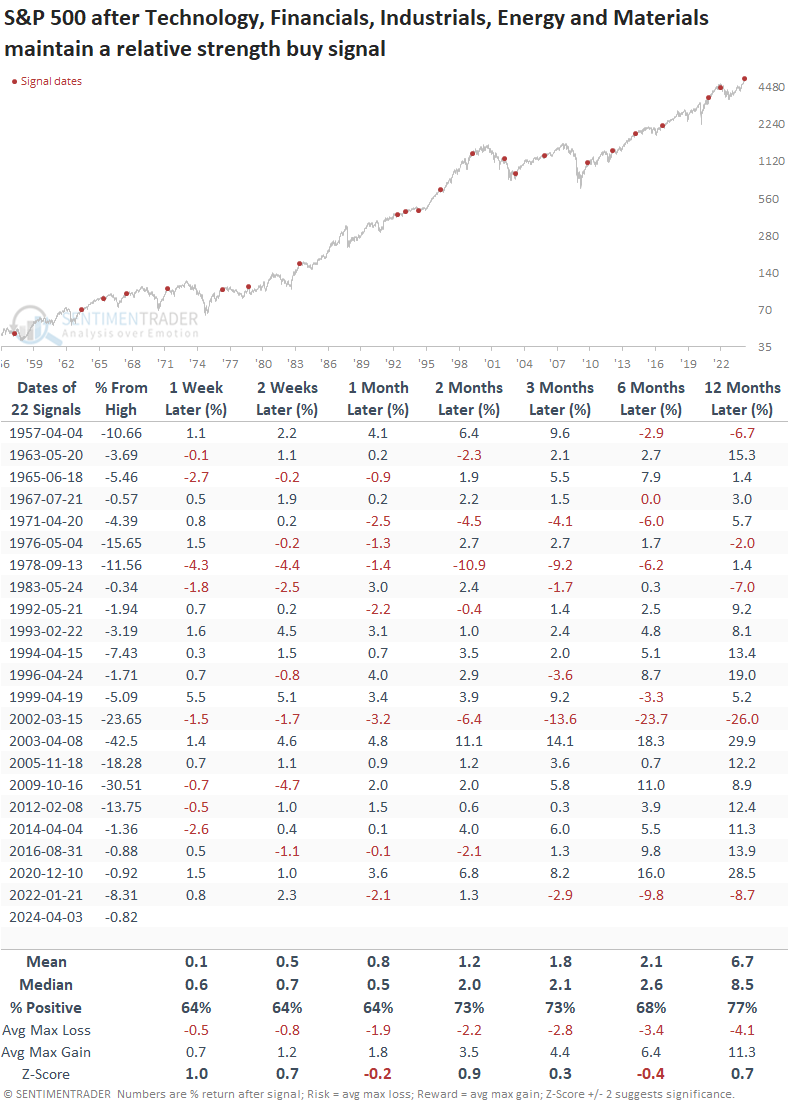
Since 1957, this relative trend configuration has transpired on numerous occasions. However, several precedents occurred with the S&P 500 significantly below an all-time high. Therefore, to provide context similar to now, I will require the large-cap index to reach an all-time high and hover within 5% of that peak.
If we zoom in, we can see the progression of sectors moving to a relative strength buy signal as the S&P 500 rose to a new all-time high, culminating in the Materials alert on Wednesday.
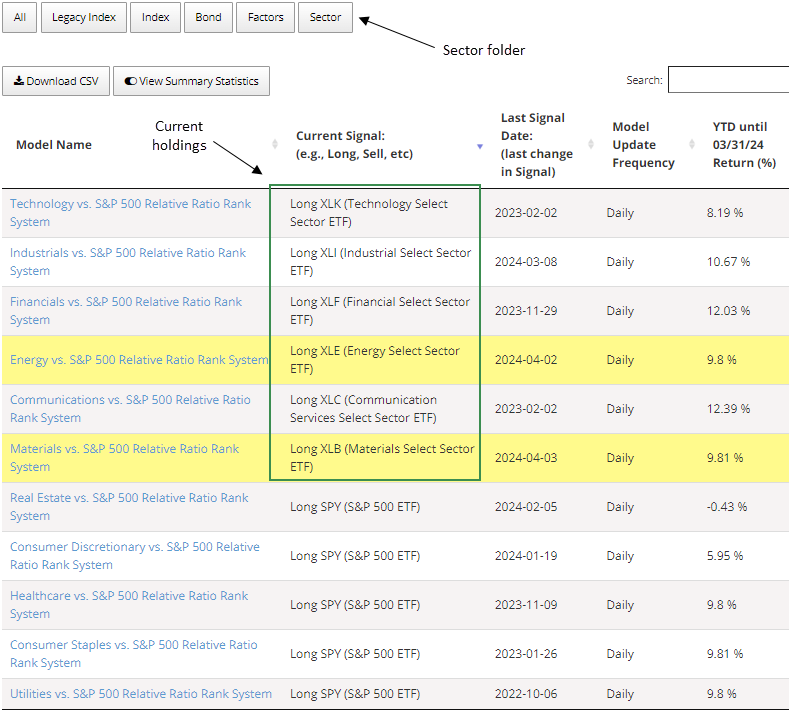
Website subscribers can monitor these relative strength timing models on the strategies page in the sector folder.
Similar relative trend profiles preceded a bullish outlook for the S&P 500
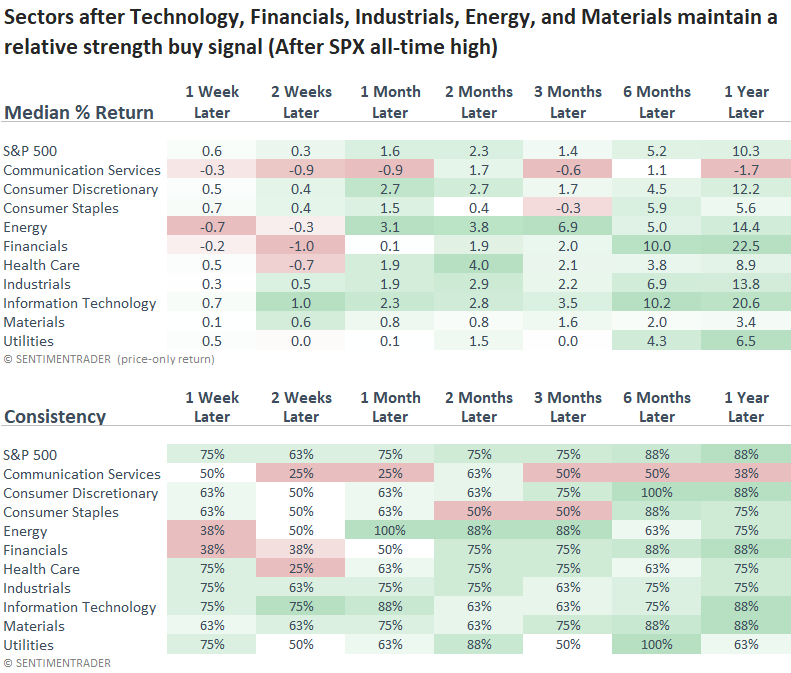
While the sample size is small, when several cyclical sectors maintain a positive relative trend profile, with the S&P 500 near an all-time high, the world's most benchmarked index performed exceptionally well, especially over the following six and twelve months.
No precedent exceeded a maximum loss of more than -7% over the following year. In case you were wondering, that instance occurred in 1983.
Over the subsequent year, every single cyclical sector on a relative strength buy signal outperformed the S&P 500, with Financials displaying the best return.
Suppose you wondered how the S&P 500 performed when the cyclical sectors maintained a relative strength buy signal without the all-time high condition. In that case, the world's most benchmarked index still displayed solid returns, notwithstanding a head fake in 2002.
Relative trends shed light on the potential for a market peak
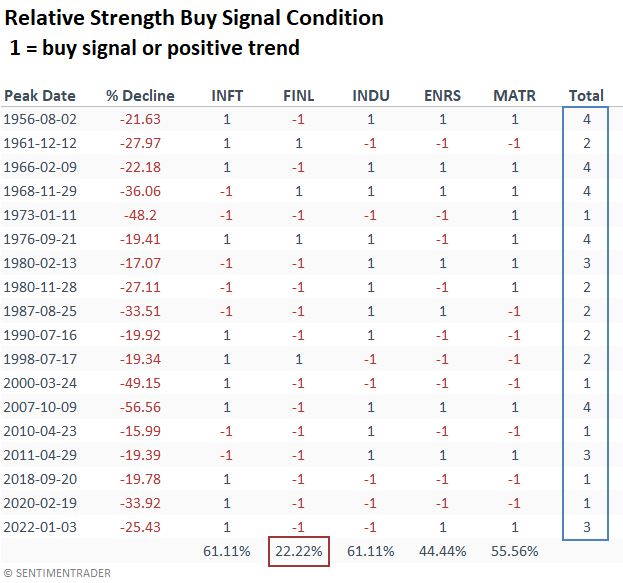
Not once before a market correction surpassing 15% or a bear market did a relative strength buy signal count maintain a level of five, like now. What's more, Financials displayed a positive relative trend profile merely 22% of the time at the S&P 500's peak, a scenario that differs from the current market backdrop.
What the research tells us...
When cyclical sectors display positive relative trends versus the broad market, it often signals promising prospects for both the S&P 500 and cyclical sectors. These sectors, sensitive to the business cycle, thrive when economic conditions improve. Following similar relative trend backdrops, the S&P 500 rose over the subsequent six and twelve months in 88% of cases. However, investors reaped even more fantastic rewards if they directed their investments towards one of the cyclical sectors, as each of them surpassed the performance of the S&P 500 a year later.