Products
SentimenTrader Trading Tools
‍
Backtest Engine
My Trading Toolkit
Correlation Analysis
Seasonality
Market Prediction
Indicators & Data API
‍
Proprietary Indicators & Charts
Market Data API
Strategies & Scanner
‍
50+ Trading Strategies
Smart Stock Scanner
Smart Option Scanner
Research Reports
‍
Research Solutions
Reports Library
Free Resources
Simple Backtest Calculator
Simple Seasonality Calculator
The Kelly Criterion Calculator
Sentiment Geo Map
Public Research Reports
Education
Sentiment Indicators
Technical Indicators
Pricing
Company
About
In the News
Testimonials
Client Success Stories
Contact
Log inLoginSign up
< BACK TO ALL REPORTS

A bullish confirmation from cyclicals

Dean Christians
2024-07-22
For only the 20th time since 1958, the average distance from a 52-week high for a composite of cyclical groups cycled from below -20% to above -2.5%, triggering an alert for a TCTM Composite Confirmation Model member. Comparable alerts displayed a 100% win rate for the S&P 500 over the subsequent year.

Key points:

  • The average distance below a high for a basket of cyclical groups climbed within 2.5% of a 52-week high
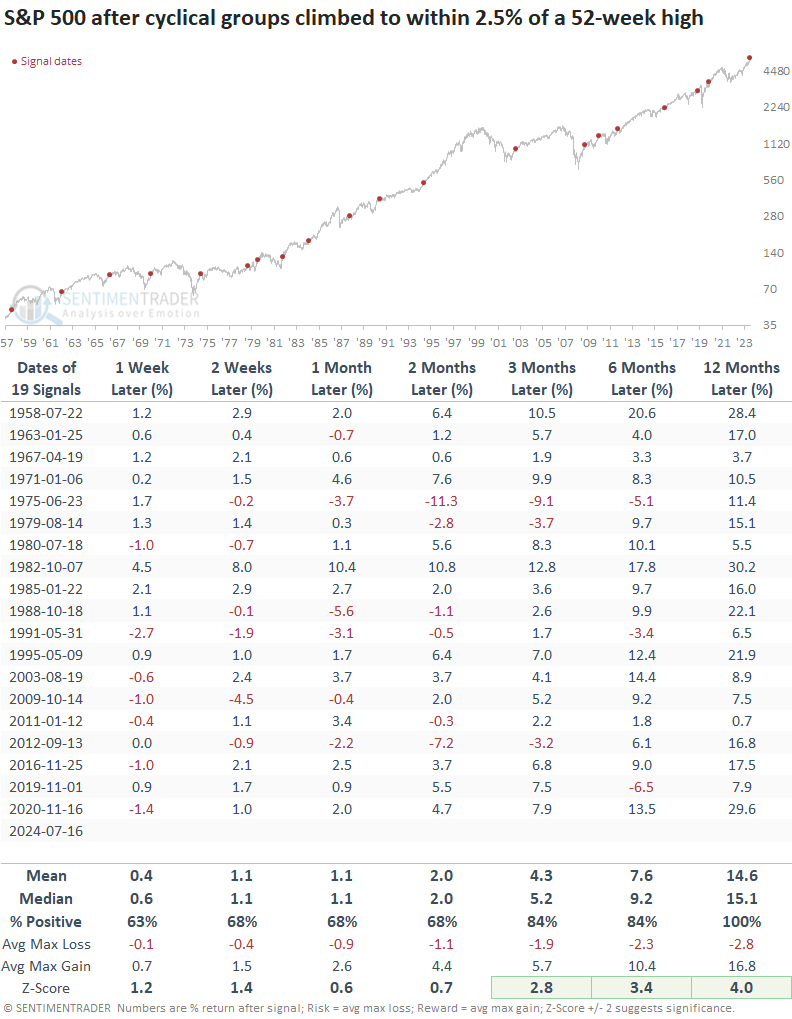
  • Comparable participation trends preceded a 100% win rate for the S&P 500 over the following year
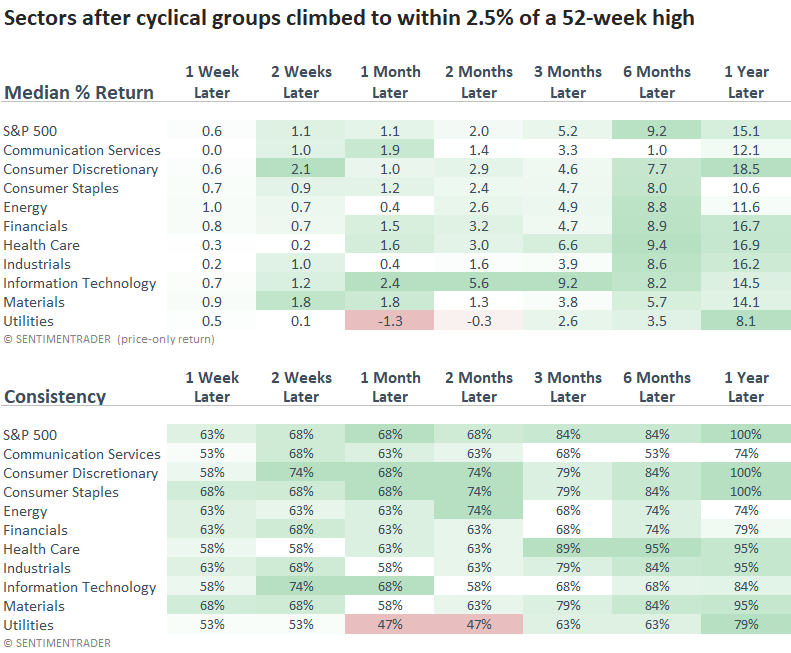
  • Most cyclical groups outperformed the world's most benchmarked index across multiple time frames

Cyclical groups suggest the uptrend persists

Following a rapid rise in interest rate-sensitive stocks, a composite that measures the average distance below a high for a group of cyclical industries climbed to within 2.5% of a 52-week high, triggering a signal for a member in the TCTM Composite Confirmation Model.

The purpose of this model is not to provide a timely market signal but rather to validate a transition from a bearish to a bullish trend. Thus, even though it took 440 sessions to trigger after the October 2022 low-far exceeding the average of 169-I still see the alert as a favorable sign for the bulls.

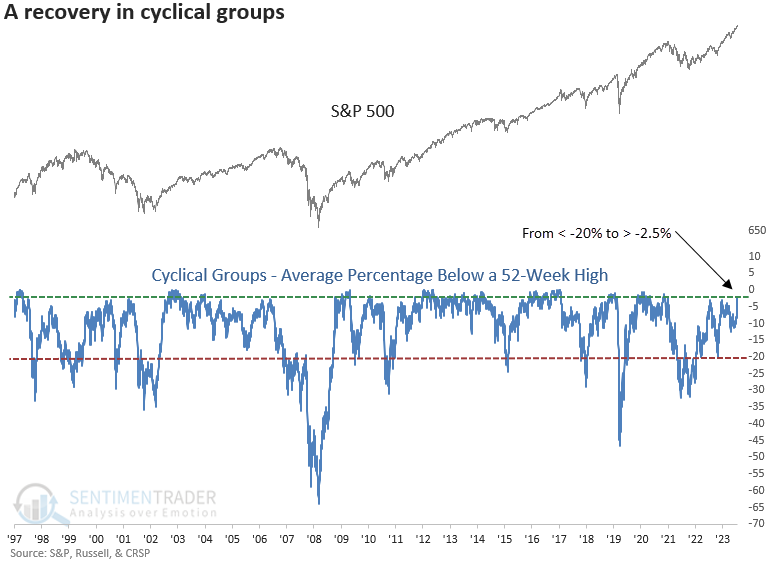
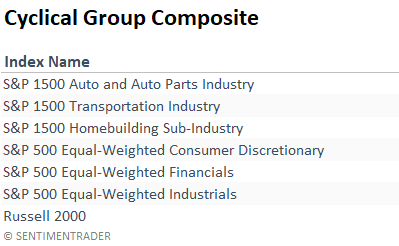
The composite includes industries from a broad spectrum of the economy, encompassing automobiles, transportation, housing, consumer goods, banking and credit, manufacturing, and small businesses.

Although several members of the composite approached or surpassed their 52-week highs months ago, the Auto/Auto Parts index (due to Tesla's influence) and the Russell 2000 index (impacted by regional banks) significantly weighed upon the composite average until a significant surge in small-cap stocks last week.

Comparable participation trends preceded positive returns

When the average distance from a 52-week high for a composite of cyclical groups transitioned from below -20% to above -2.5%, the S&P 500 demonstrated remarkable returns and consistency, achieving a perfect win rate a year later. Furthermore, three to twelve months later, returns showed significance relative to random returns over the study period.

Following similar precedents, cyclical sectors like Consumer Discretionary, Financials, and Industrials outperformed the S&P 500 over the subsequent year.

Technology, which is still exhibiting a positive relative trend versus the S&P 500 despite a 7% drawdown as of last Friday, typically outperformed over the ensuing three months but underperformed from six to twelve months later.

What the research tells us...

The average distance below a 52-week high for a composite of cyclical groups transitioned from below -20% to above -2.5%, triggering a bullish confirmation signal for a TCTM Composite Confirmation Model member. Similar alerts produced outstanding results for the world's most benchmarked index over the subsequent year, suggesting the uptrend persists. As I said last week, broadening is a positive development and most likely extends the duration of the advance. However, it does not always equate to a change in leadership. For now, relative trends still favor growth-oriented groups. Remember, as Jesse Livermore once said, "To anticipate the market is to gamble. To be patient and react only when the market gives the signal is to speculate."

PRODUCTS
SentimenTrader
Trading Tools
Indicators & Data API
‍
Strategies & Scanner
‍
Research Reports
FREE
RESOUrCES
Simple Backtest
Calculator
Simple Seasonality
Calculator
The Kelly Criterion
Calculator
Sentiment Geo Map
‍
Public Research Reports
‍
Education
Sentiment Indicators
‍
Technical Indicators
‍
Pricing
Bundle pricing
‍
FAQ
‍
Announcements
‍
COMPANY
‍
About
‍
In the News
‍
Testimonials
‍
Client Success Stories
CONTACT
‍
General Inquiries
‍
Media Inquiries
‍
Financial Professionals Inquiries
‍
© 2026 Sundial Capital Research Inc. All rights reserved.
Setsail Marketing
TermsPrivacyAffiliate Program
Risk Disclosure: The information and tools provided are for research and analytical purposes only and are not intended as investment advice. Market analysis involves uncertainty, and outcomes may differ from expectations. Users should conduct their own due diligence and consider their individual circumstances before making any financial decisions. Past performance is not necessarily indicative of future results.

Hypothetical Performance Disclosure: Hypothetical performance results have many inherent limitations, some of which are described below. No representation is being made that any account will or is likely to achieve profits or losses similar to those shown; in fact, there are frequently sharp differences between hypothetical performance results and the actual results subsequently achieved by any particular trading program. One of the limitations of hypothetical performance results is that they are generally prepared with the benefit of hindsight. In addition, hypothetical trading does not involve financial risk, and no hypothetical trading record can completely account for the impact of financial risk of actual trading. for example, the ability to withstand losses or to adhere to a particular trading program in spite of trading losses are material points which can also adversely affect actual trading results. There are numerous other factors related to the markets in general or to the implementation of any specific trading program which cannot be fully accounted for in the preparation of hypothetical performance results and all which can adversely affect trading results.

Testimonial Disclosure: Testimonials appearing on this website may not be representative of other clients or customers and is not a guarantee of future performance or success.