Products
SentimenTrader Trading Tools
‍
Backtest Engine
My Trading Toolkit
Correlation Analysis
Seasonality
Market Prediction
Indicators & Data API
‍
Proprietary Indicators & Charts
Market Data API
Strategies & Scanner
‍
50+ Trading Strategies
Smart Stock Scanner
Smart Option Scanner
Research Reports
‍
Research Solutions
Reports Library
Free Resources
Simple Backtest Calculator
Simple Seasonality Calculator
The Kelly Criterion Calculator
Sentiment Geo Map
Public Research Reports
Education
Sentiment Indicators
Technical Indicators
Pricing
Company
About
In the News
Testimonials
Client Success Stories
Contact
Log inLoginSign up
< BACK TO ALL REPORTS

A bullish breakout in discretionary stocks

Dean Christians
2025-08-28
With the prospect of Fed rate cuts growing, consumer discretionary stocks are emerging as clear leaders, posting a notable expansion in 52-week highs. Similar breakouts bode well for the sector and the broad market.

Key points: 

  • Discretionary stocks saw 52-week highs surge to the highest level in more than six months
  • Similar breakouts saw the sector and the broad market rally over the next year in all but one case
  • Though discretionary posted a modest relative advantage, technology displayed an overwhelming edge

Consumer cyclical stocks break out

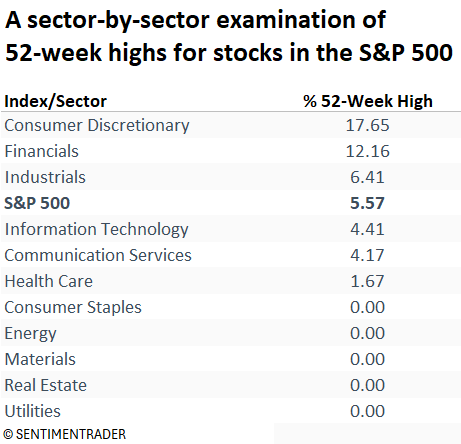
On Wednesday, the consumer discretionary sector emerged as the clear leader, posting the highest number of 52-week highs among all groups.

The expansion in new highs marked a notable shift, as it was the first time since the April lows that breakouts in the discretionary sector outnumbered those in other key cyclical groups, such as industrials, financials, and technology.

With elevated expectations for a September Fed rate cut, consumer cyclical stocks are attracting renewed attention, as lower yields tend to support borrowing and spending, a key driver for this sector. 

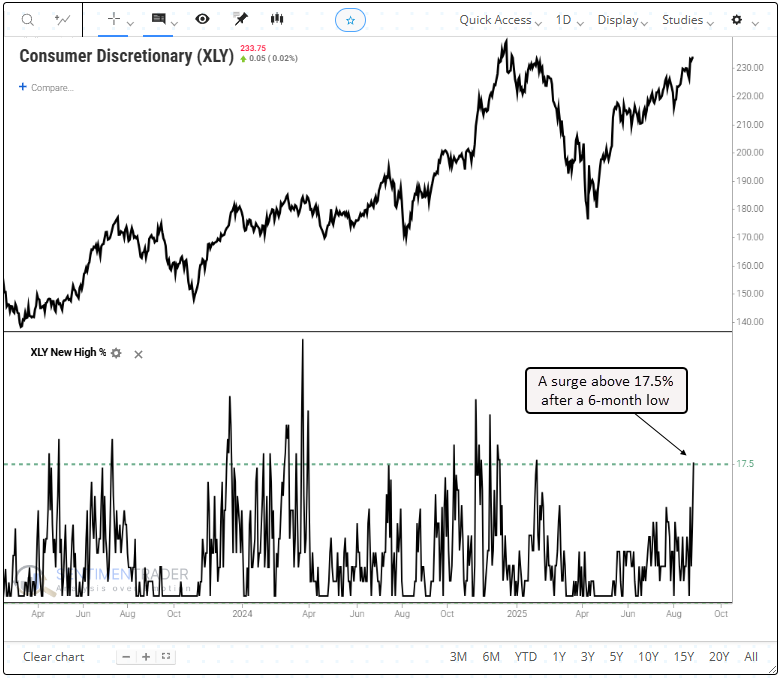
The consumer discretionary sector topped all other groups in 52-week highs on Wednesday, in a session where breakouts were generally pro-cyclical. 

A bullish bias

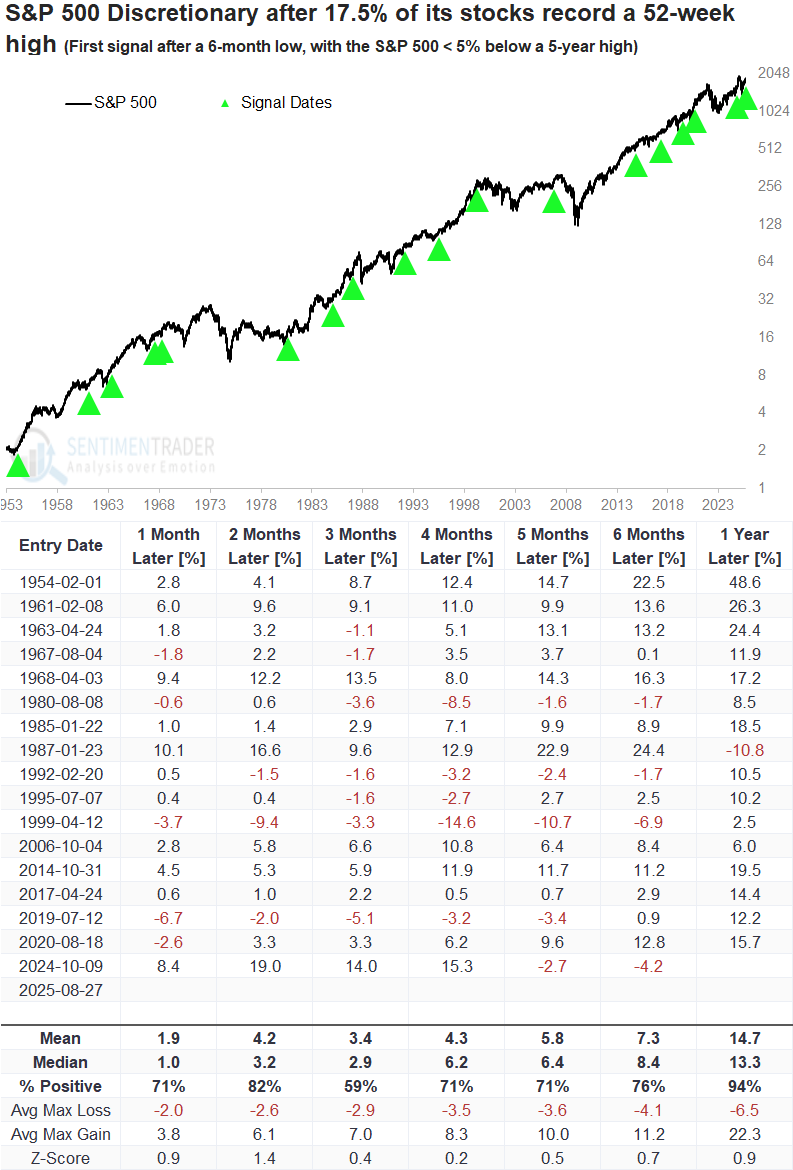
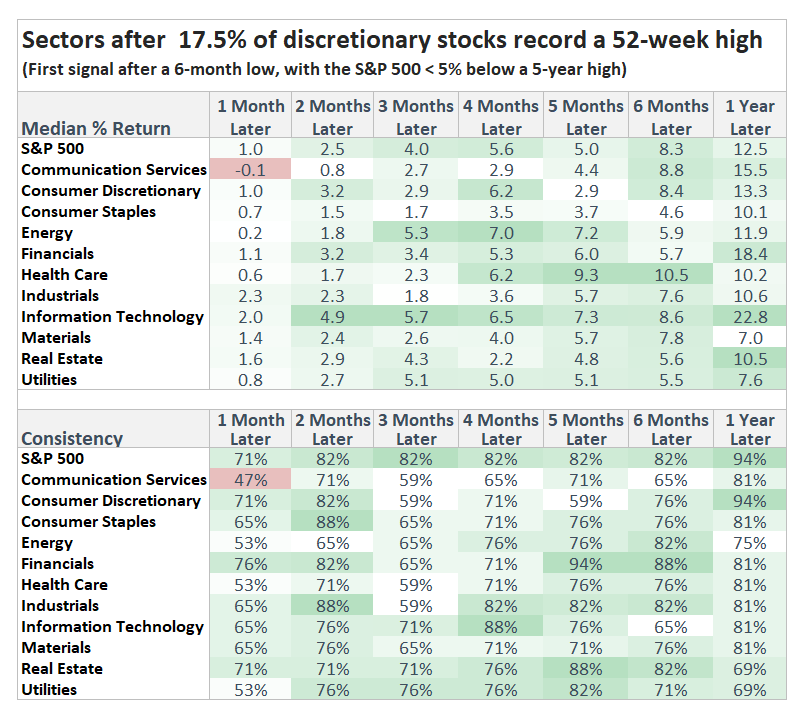
Whenever 17.5% of consumer discretionary stocks hit a 52-week high for the first time after a six-month low, and the S&P 500 was less than 5% below a five-year high, consumer cyclicals tended to move higher over the next year, posting gains in all but one case.

The single loss observed a year later initially showed substantial gains but ultimately fell victim to the 1987 crash, a highly unusual outcome. It's also worth noting that the negative signal in 1999 occurred just before the Fed began a rate-hiking cycle, which is quite different from today, given the odds of a September rate cut. 

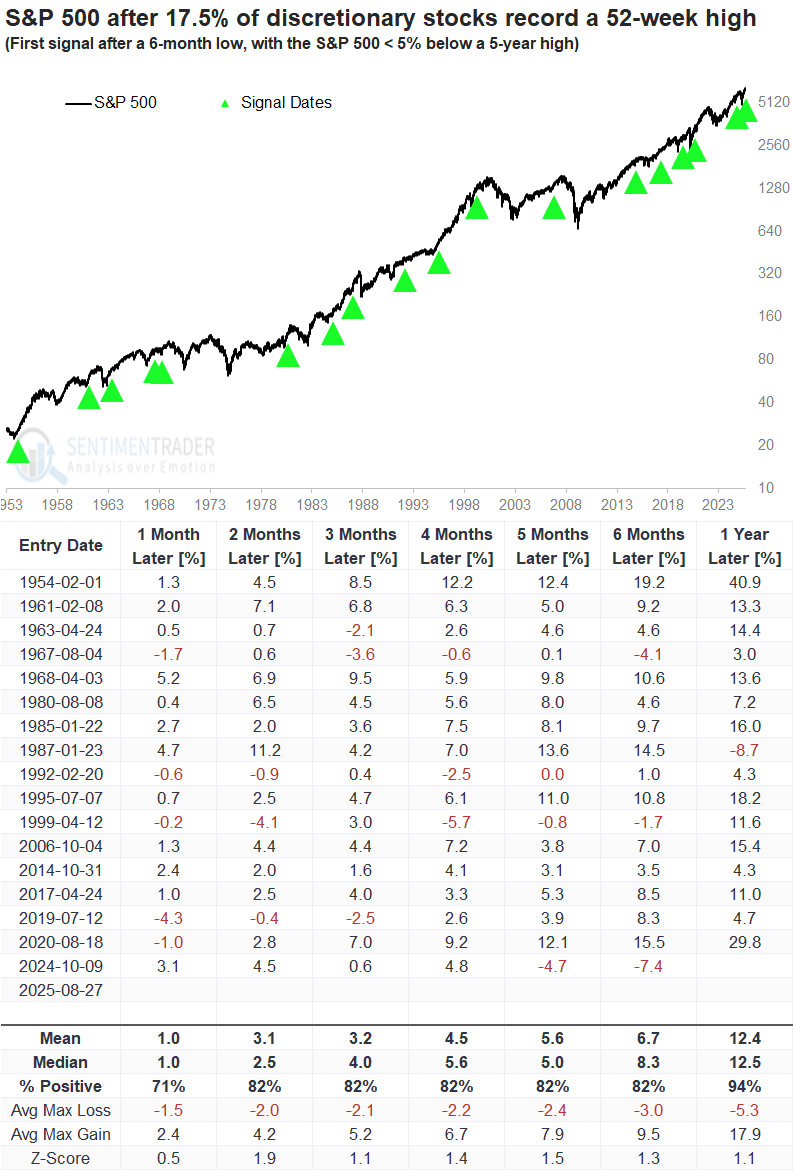
When a surge in 52-week highs occurred for stocks in the discretionary sector, it typically indicated a bullish backdrop for the broader market. In fact, the S&P 500 went on to rise in nearly every case a year later, echoing the sector's outlook. However, the world's most benchmarked index actually showed stronger win rates in the three- to six-month window. 

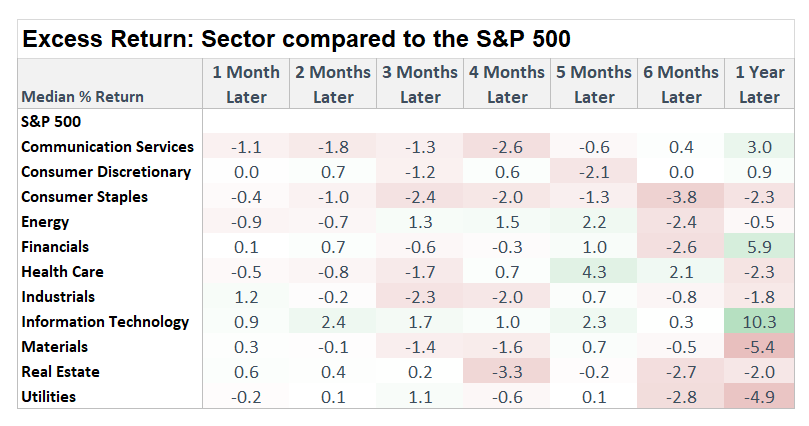
A year later, the consumer discretionary, financials, and technology sectors outperformed the S&P 500, indicating that a surge in breakouts from the discretionary sector was a positive development for cyclical groups. 

Although the consumer discretionary sector outperformed the S&P 500 in most time horizons, the excess return wasn't overwhelming. On the other hand, returns for the technology sector exceeded those of the broad market across all intervals. 

While the tech sector has recently succumbed to profit-taking, big-picture trends still look constructive, suggesting investors maintain a healthy portfolio weighting.

What the research tells us...

On Wednesday, consumer discretionary stocks led all sectors by registering the highest proportion of 52-week highs. This leadership is a positive signal not only for the sector itself but also for the broader U.S. equity market, given the economy's heavy reliance on consumer spending.  

PRODUCTS
SentimenTrader
Trading Tools
Indicators & Data API
‍
Strategies & Scanner
‍
Research Reports
FREE
RESOUrCES
Simple Backtest
Calculator
Simple Seasonality
Calculator
The Kelly Criterion
Calculator
Sentiment Geo Map
‍
Public Research Reports
‍
Education
Sentiment Indicators
‍
Technical Indicators
‍
Pricing
Bundle pricing
‍
FAQ
‍
Announcements
‍
COMPANY
‍
About
‍
In the News
‍
Testimonials
‍
Client Success Stories
CONTACT
‍
General Inquiries
‍
Media Inquiries
‍
Financial Professionals Inquiries
‍
© 2026 Sundial Capital Research Inc. All rights reserved.
Setsail Marketing
TermsPrivacyAffiliate Program
Risk Disclosure: The information and tools provided are for research and analytical purposes only and are not intended as investment advice. Market analysis involves uncertainty, and outcomes may differ from expectations. Users should conduct their own due diligence and consider their individual circumstances before making any financial decisions. Past performance is not necessarily indicative of future results.

Hypothetical Performance Disclosure: Hypothetical performance results have many inherent limitations, some of which are described below. No representation is being made that any account will or is likely to achieve profits or losses similar to those shown; in fact, there are frequently sharp differences between hypothetical performance results and the actual results subsequently achieved by any particular trading program. One of the limitations of hypothetical performance results is that they are generally prepared with the benefit of hindsight. In addition, hypothetical trading does not involve financial risk, and no hypothetical trading record can completely account for the impact of financial risk of actual trading. for example, the ability to withstand losses or to adhere to a particular trading program in spite of trading losses are material points which can also adversely affect actual trading results. There are numerous other factors related to the markets in general or to the implementation of any specific trading program which cannot be fully accounted for in the preparation of hypothetical performance results and all which can adversely affect trading results.

Testimonial Disclosure: Testimonials appearing on this website may not be representative of other clients or customers and is not a guarantee of future performance or success.