Products
SentimenTrader Trading Tools
‍
Backtest Engine
My Trading Toolkit
Correlation Analysis
Seasonality
Market Prediction
Indicators & Data API
‍
Proprietary Indicators & Charts
Market Data API
Strategies & Scanner
‍
50+ Trading Strategies
Smart Stock Scanner
Smart Option Scanner
Research Reports
‍
Research Solutions
Reports Library
Free Resources
Simple Backtest Calculator
Simple Seasonality Calculator
The Kelly Criterion Calculator
Sentiment Geo Map
Public Research Reports
Education
Sentiment Indicators
Technical Indicators
Pricing
Company
About
In the News
Testimonials
Client Success Stories
Contact
Log inLoginSign up
< BACK TO ALL REPORTS

A bullish breakout for natural gas

Dean Christians
2023-10-09
After a prolonged bear market and base-building process, natural gas broke out to a new 6-month high. Similar breakout patterns led to an 80% win rate over the following three months.

Key points:

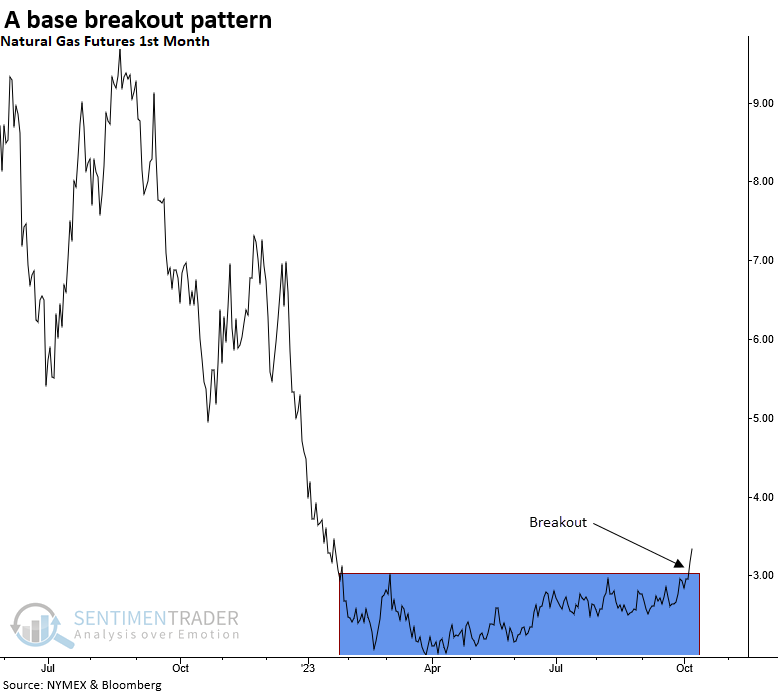
  • Natural gas futures closed at a 6-month high but not a 9-month high, completing a base breakout
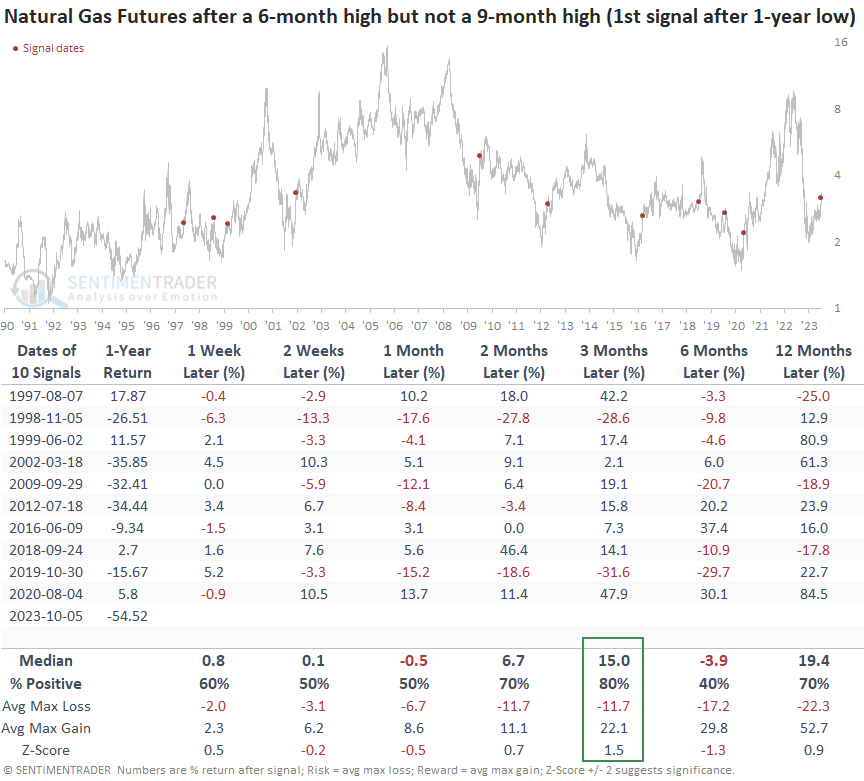
  • Similar breakouts after a 1-year low led to an 80% win rate over the subsequent three months
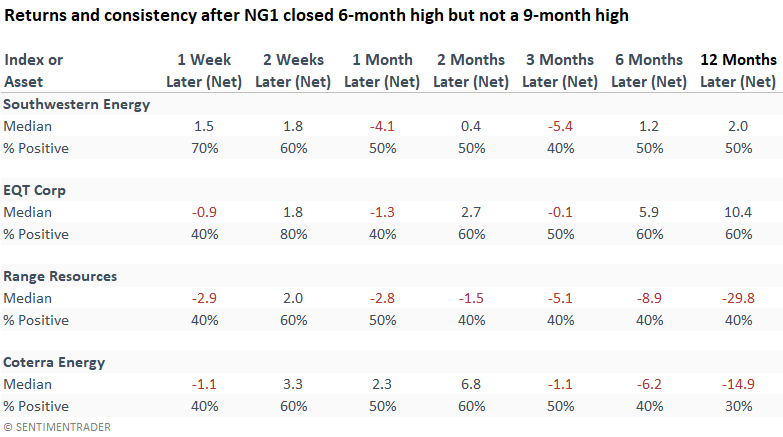
  • Despite the outlook in the commodity, natural gas stocks failed to participate in the upside

A potential bearish to bullish transition in natural gas 

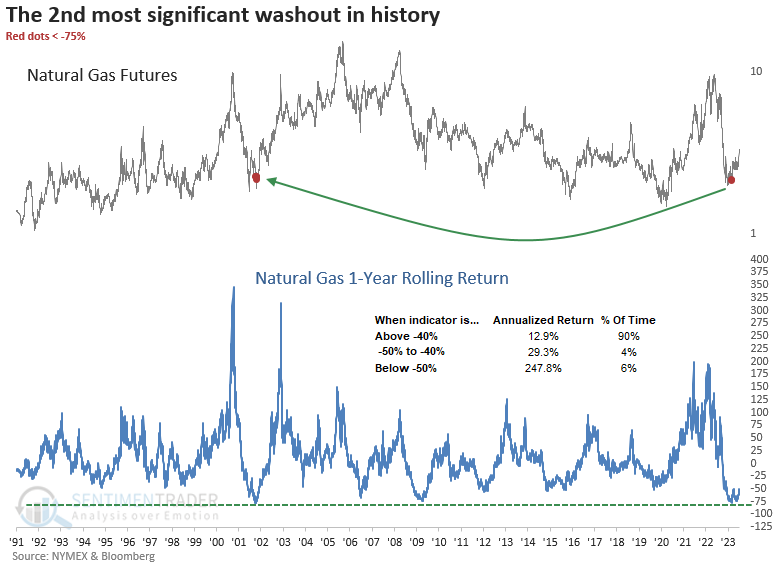
Natural gas experienced one of the most severe drawdown periods in history, as its 1-year rolling return plummeted by -76.82%, second only to the -77.25% decline witnessed in January 2002.

When assets experience a significant drawdown phase, they often go through a healing process. The market tends to move sideways for a while before eventually shifting upward to usher in a new bull market. Justin Mamas called this process the sentiment cycle.

Last week, natural gas closed at a new 6-month high but not a 9-month high, completing a base breakout pattern after a significant drawdown period.

Despite the rally from the April low, the 1-year rolling return remains at a level suggesting bullish annualized returns.

Similar breakouts suggest natural gas can rally further

When natural gas completes a base breakout pattern after a 1-year low, returns are somewhat uninspiring in the first month, suggesting some backing and filling could occur. After the pause, performance picked up, with the commodity rallying 80% of the time over the subsequent three months. The six-month outlook should act as a reminder that nothing comes easy when it comes to natural gas. 

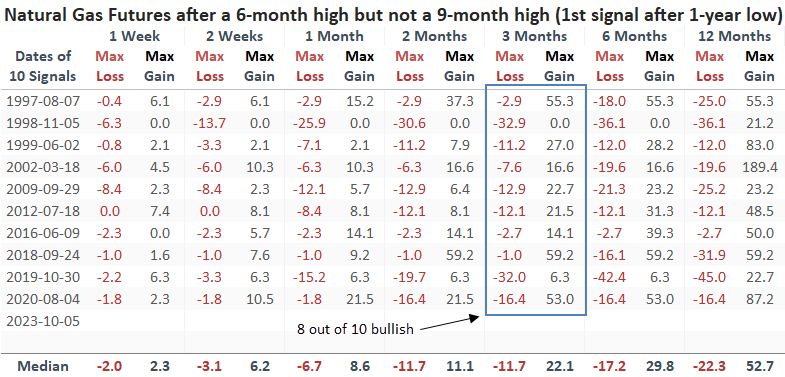
The max median gain exceeded the max median loss in 8 out of 10 precedents, with some showing significant risk/reward profiles. 

Natural gas stocks

Surprisingly, the returns and win rates of various natural gas stocks appeared lackluster. Therefore, it might be wiser to consider an allocation to the physical commodity itself, a task made accessible through an ETF like UNG.
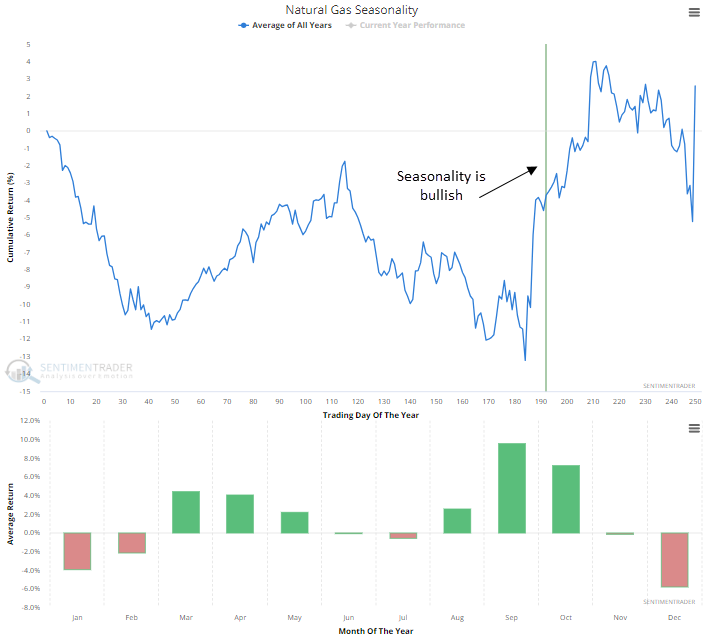
Seasonality

If history rhymes, seasonality should provide a tailwind for the next several weeks.


What the research tells us...

Natural gas trading is not for the faint-hearted. After enduring the second-worst one-year rolling return period in history, natural gas spent most of this year in a sideways pattern, slowly recovering from the damage. However, a significant development occurred just last week when it soared to a new six-month high, hinting at the possibility of a transition to an uptrend. Similar breakout patterns for natural gas saw gains 80% of the time over the ensuing three months. Interestingly, natural gas stocks remained on the sidelines while the commodity rallied.

PRODUCTS
SentimenTrader
Trading Tools
Indicators & Data API
‍
Strategies & Scanner
‍
Research Reports
FREE
RESOUrCES
Simple Backtest
Calculator
Simple Seasonality
Calculator
The Kelly Criterion
Calculator
Sentiment Geo Map
‍
Public Research Reports
‍
Education
Sentiment Indicators
‍
Technical Indicators
‍
Pricing
Bundle pricing
‍
FAQ
‍
Announcements
‍
COMPANY
‍
About
‍
In the News
‍
Testimonials
‍
Client Success Stories
CONTACT
‍
General Inquiries
‍
Media Inquiries
‍
Financial Professionals Inquiries
‍
© 2026 Sundial Capital Research Inc. All rights reserved.
Setsail Marketing
TermsPrivacyAffiliate Program
Risk Disclosure: The information and tools provided are for research and analytical purposes only and are not intended as investment advice. Market analysis involves uncertainty, and outcomes may differ from expectations. Users should conduct their own due diligence and consider their individual circumstances before making any financial decisions. Past performance is not necessarily indicative of future results.

Hypothetical Performance Disclosure: Hypothetical performance results have many inherent limitations, some of which are described below. No representation is being made that any account will or is likely to achieve profits or losses similar to those shown; in fact, there are frequently sharp differences between hypothetical performance results and the actual results subsequently achieved by any particular trading program. One of the limitations of hypothetical performance results is that they are generally prepared with the benefit of hindsight. In addition, hypothetical trading does not involve financial risk, and no hypothetical trading record can completely account for the impact of financial risk of actual trading. for example, the ability to withstand losses or to adhere to a particular trading program in spite of trading losses are material points which can also adversely affect actual trading results. There are numerous other factors related to the markets in general or to the implementation of any specific trading program which cannot be fully accounted for in the preparation of hypothetical performance results and all which can adversely affect trading results.

Testimonial Disclosure: Testimonials appearing on this website may not be representative of other clients or customers and is not a guarantee of future performance or success.