
A bullish blast in breadth

Key points:
- NYSE advancers outpaced decliners by a ratio of 4 to 1 in recent sessions
- Similar skews suggest the uptrend in stocks will persist
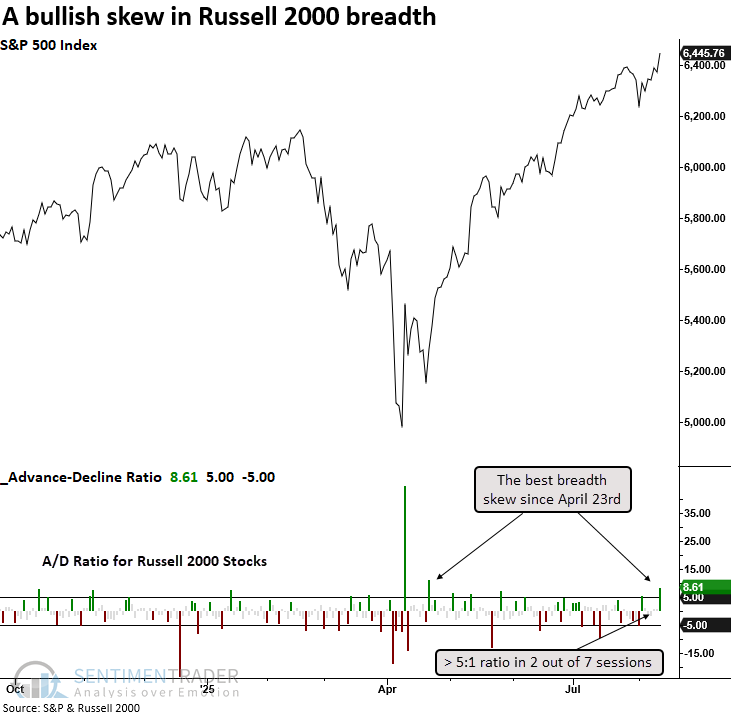
- The Russell 2000 saw an equally impressive breadth blast
Dip buyers returned
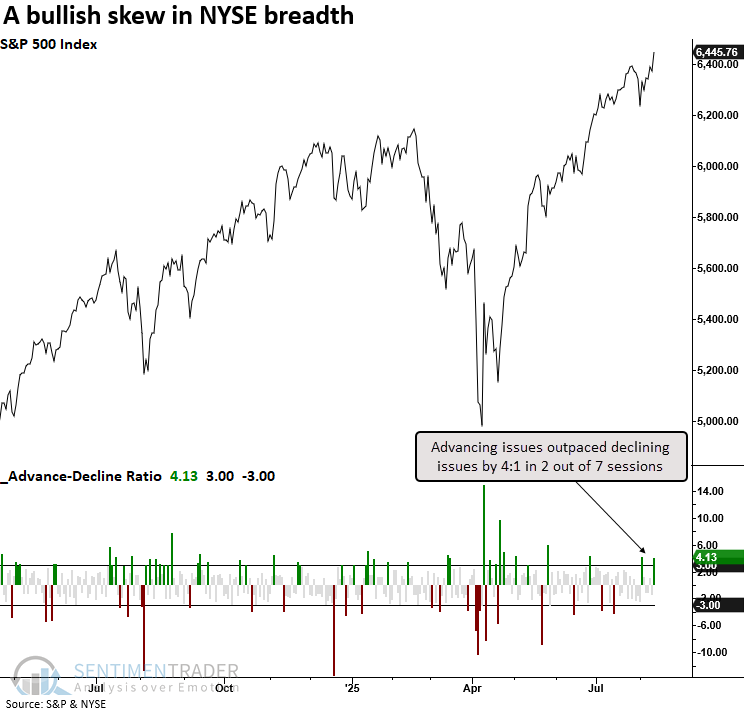
Following a four-day pullback, buyers regained control, propelling the S&P 500 to fresh record territory on Tuesday. Market breadth was equally impressive, as NYSE advancers outpaced decliners by a 4-to-1 margin in two of the last seven sessions.
We're left wondering whether this favorable breadth skew marks a last gasp of buying exhaustion or a continuation signal, suggesting that the uptrend remains intact.
The advance should persist
It's been a decent sign for a persistent rally when the NYSE advance-decline ratio surpassed 3-to-1 in two of seven trading sessions, and the S&P 500 capped it off with a record high.
Similar instances saw the world's most benchmarked index display median returns that exceeded random outcomes in all but one time frame, and consistency that was favorable, but not overwhelming.
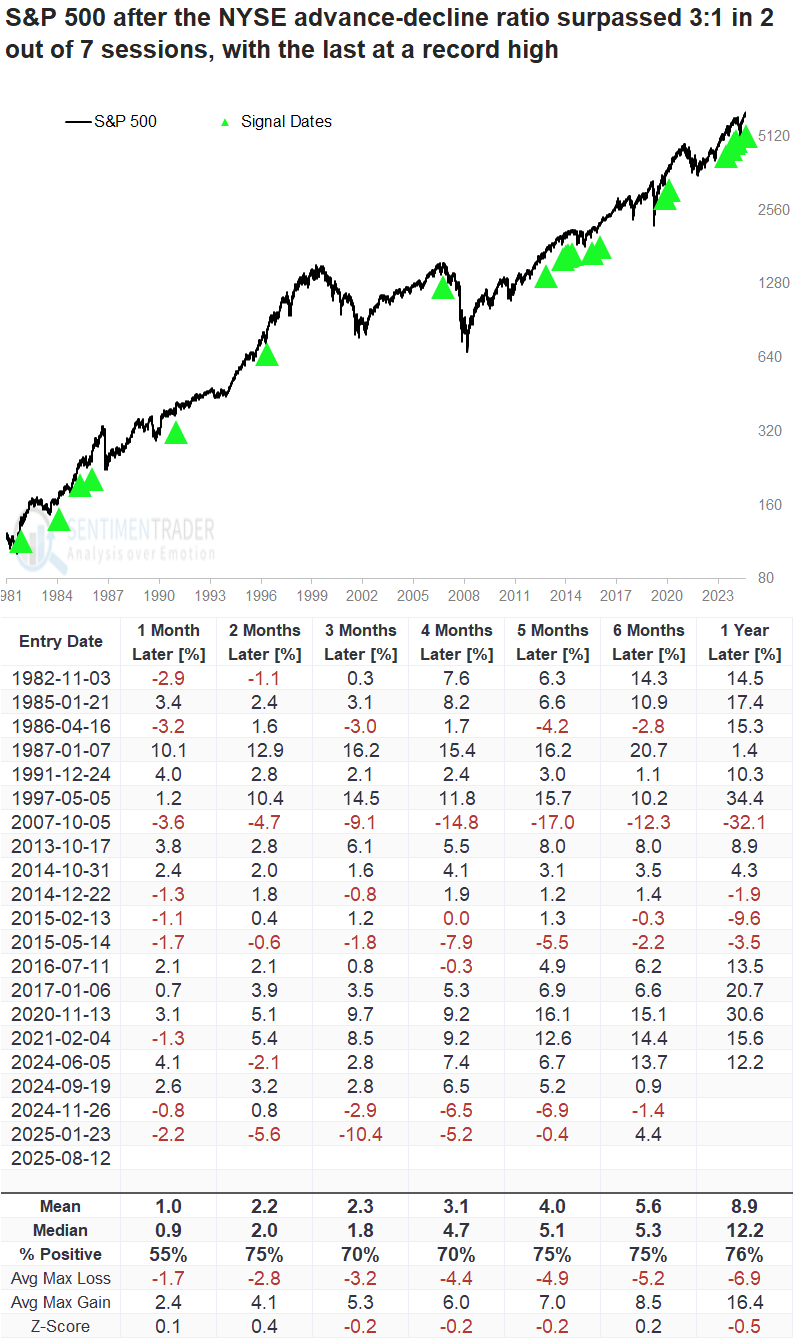
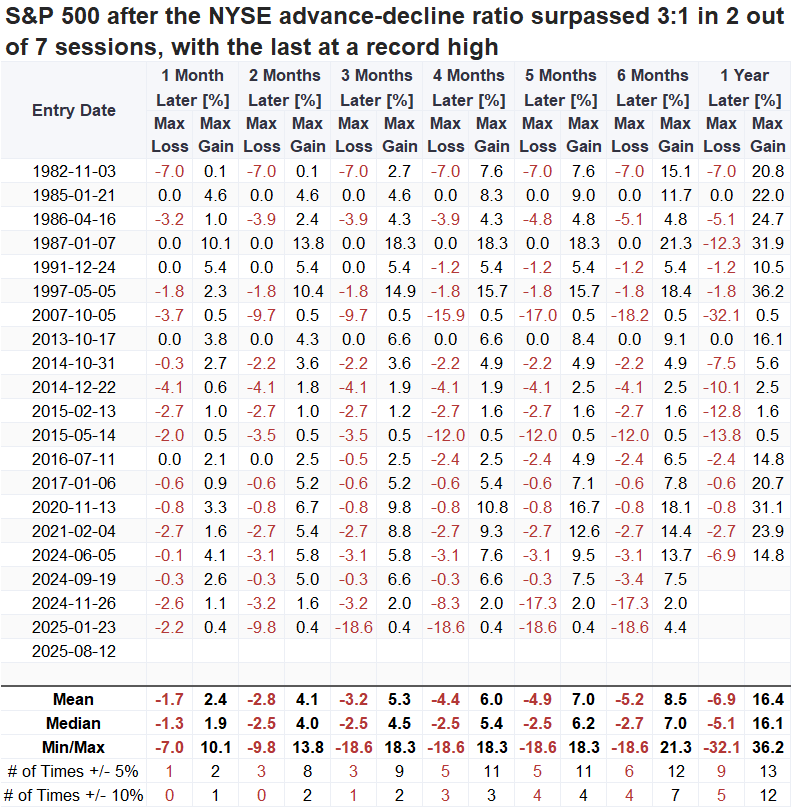
In the next three months, downside risk was mild, with only a single instance of a 10% loss. That said, gains of 10% or more were also rare, just two cases, implying that investors should keep their expectations in check.
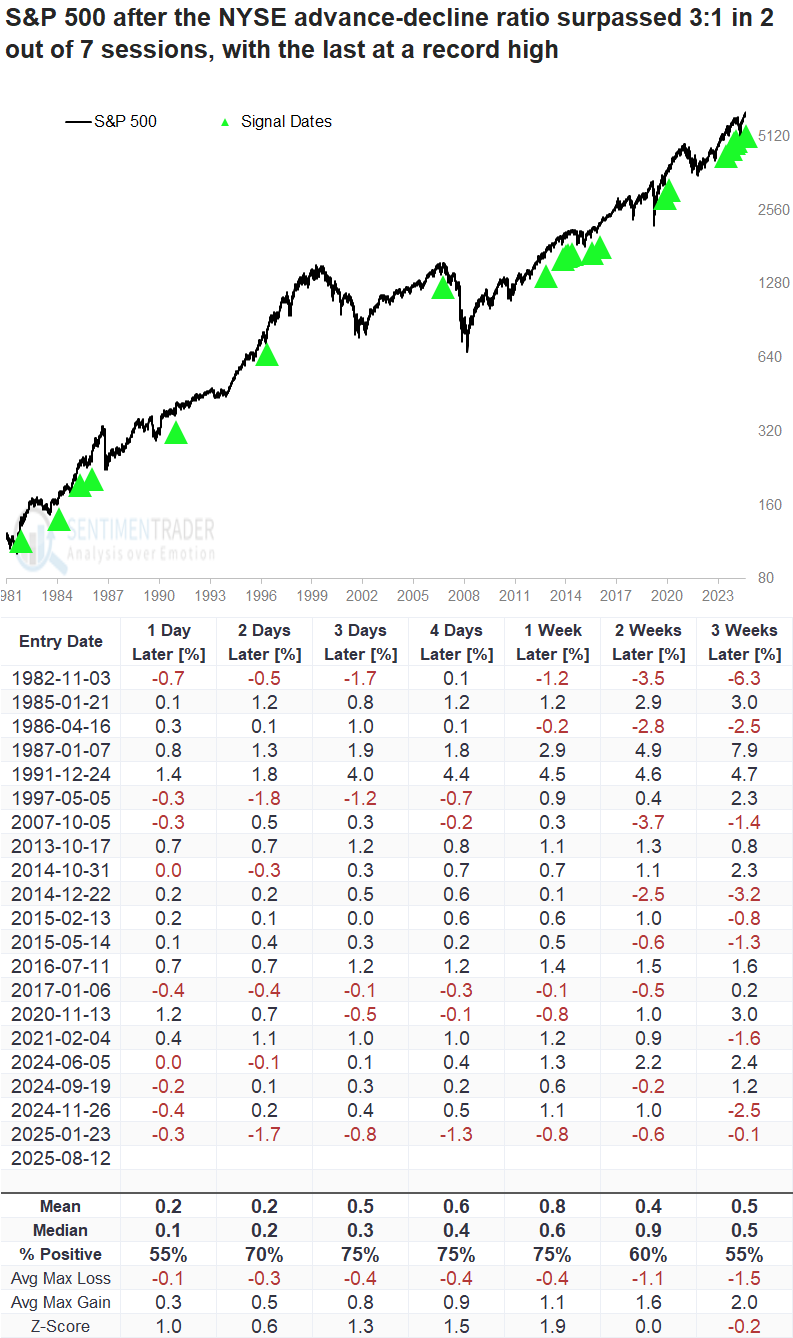
Over short time frames, the S&P 500 demonstrated a strong tendency to extend its rally over the following week, though the last four occurrences experienced some giveback the next day.
The Russell 2000 surged on Tuesday, resulting in an advance-decline ratio of 8:1, the best skew since April 23rd, when stocks were emerging from the liberation day meltdown.
Out of the five instances when the ratio exceeded 5:1 in 2 out of 7 sessions, with the S&P 500 at a record high, the world's most benchmarked index, and the Russell 2000, were higher three months later every time.
The buyer's exhaustion example
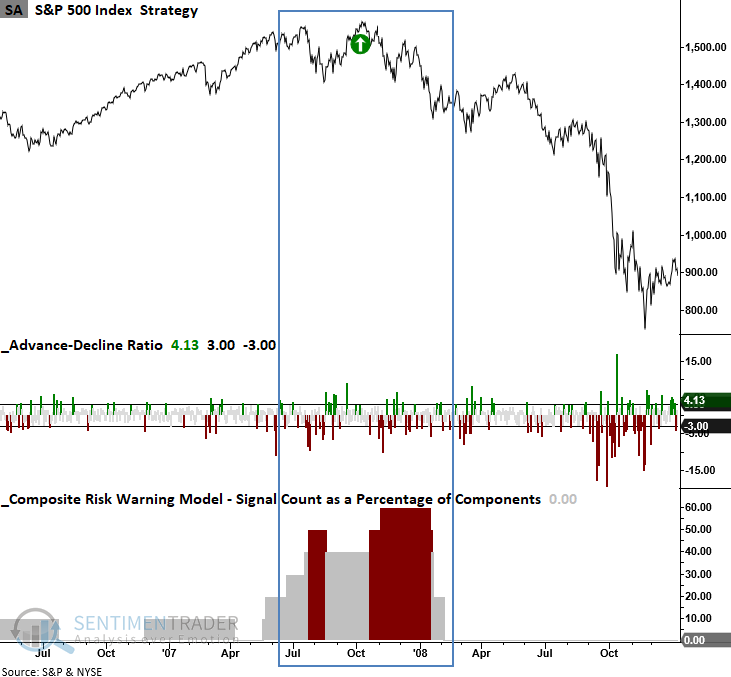
The 2007 and 2015 instances produced the most adverse outcomes, signaling a "last gasp" buyer's exhaustion scenario.
As shown below, the 2007 case unfolded amid a topping process, with the TCTM Risk Warning Model indicating heightened risk amid a surge in signal activity.
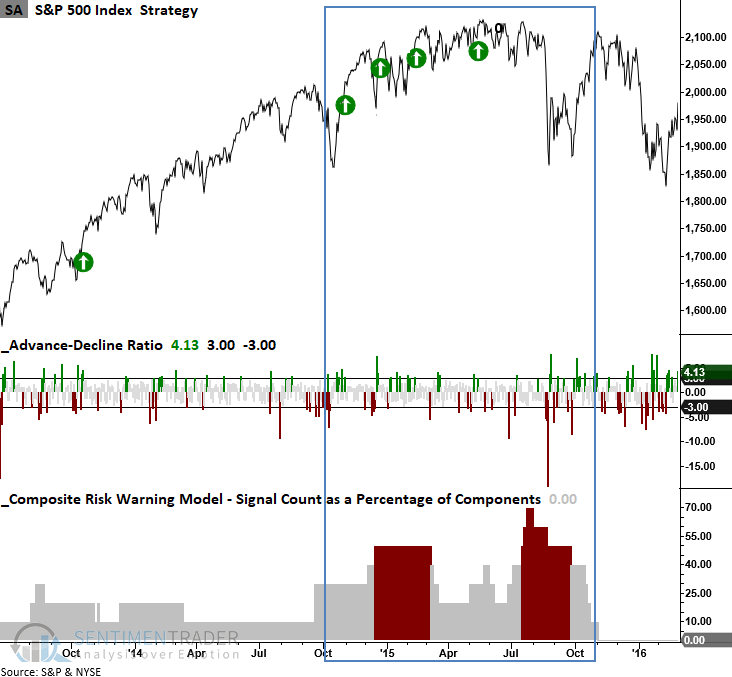
In 2015, several instances occurred as the market was forming a distribution top, as indicated by an elevated TCTM Risk Warning Model signal count.
Today, the TCTM Risk Warning Model count stands at 0%.
What the research tells us...
Over the past seven sessions, the NYSE advance-decline ratio showed a favorable skew on two occasions, with the last coinciding with the S&P 500 reaching a record high. Comparable breadth dynamics tended to support the continuation of the uptrend, though typically at a more moderate pace.
The Russell 2000 also demonstrated constructive breadth dynamics, a type of reading that has historically provided a medium-term tailwind for small-cap stocks. While the positive breadth in small caps is encouraging, we would not use this development as a call to action, to rush out and buy the Russell 2000 ETF (IWM). Instead, it serves primarily as another confirming data point reinforcing a more favorable broad market backdrop.