Products
SentimenTrader Trading Tools
‍
Backtest Engine
My Trading Toolkit
Correlation Analysis
Seasonality
Market Prediction
Indicators & Data API
‍
Proprietary Indicators & Charts
Market Data API
Strategies & Scanner
‍
50+ Trading Strategies
Smart Stock Scanner
Smart Option Scanner
Research Reports
‍
Research Solutions
Reports Library
Free Resources
Simple Backtest Calculator
Simple Seasonality Calculator
The Kelly Criterion Calculator
Sentiment Geo Map
Public Research Reports
Education
Sentiment Indicators
Technical Indicators
Pricing
Company
About
In the News
Testimonials
Client Success Stories
Contact
Log inLoginSign up
< BACK TO ALL REPORTS

A broken correlation between growth and value

Jason Goepfert
2024-09-03
Value and growth stocks have shown a historically low correlation over the past six months. In nearly 100 years, it has been lower only once, in the spring of 2021. During the past 25 years, a low correlation between these factors has preceded trouble for the S&P 500.

Key points:

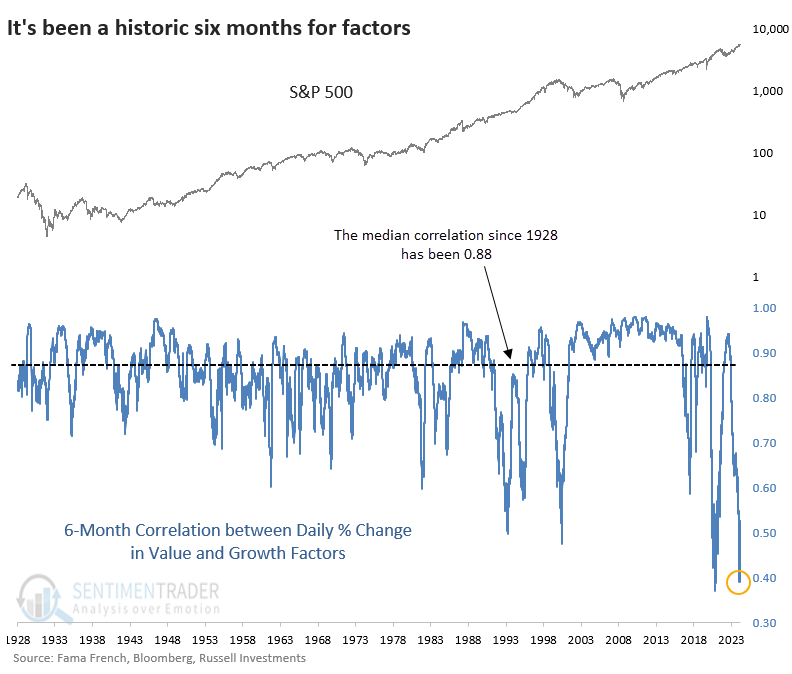
  • Over the past 6 months, the correlation between value and growth stocks plunged to a near-record low
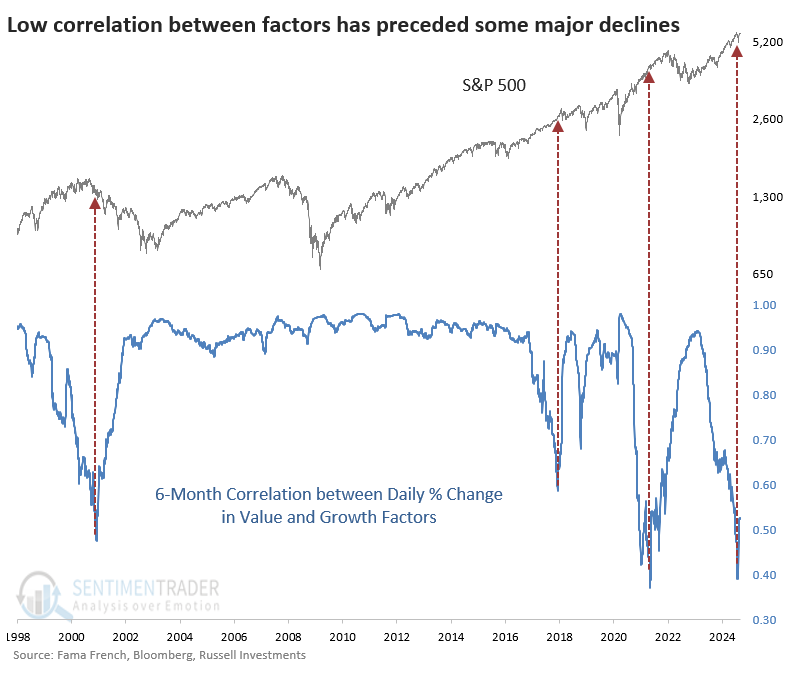
  • Since 1998, a low correlation between those factors preceded significant stock market peaks
  • A longer history shows it hasn't been quite this ominous of a signal, especially for value stocks

A broken relationship

It's no secret that the stock market has been disjointed this year. This was evident as early as January, but when small-cap cap stocks started to perk up, some of the divergences melted away.

One that did was the activity in value and growth stocks. Almost daily, one of those factors would rise while the other fell. That has preceded one of the lowest correlations over six months in nearly 100 years. The only time since 1928 when the correlation was lower was May 2021.

If we zoom in on the chart and look at the past 25 years, there is reason to be concerned. Each time the correlation deteriorated significantly, it preceded trouble in the S&P 500.

We try to be objective, however, and objectively, it's not quite that clear-cut.

A good sign for value

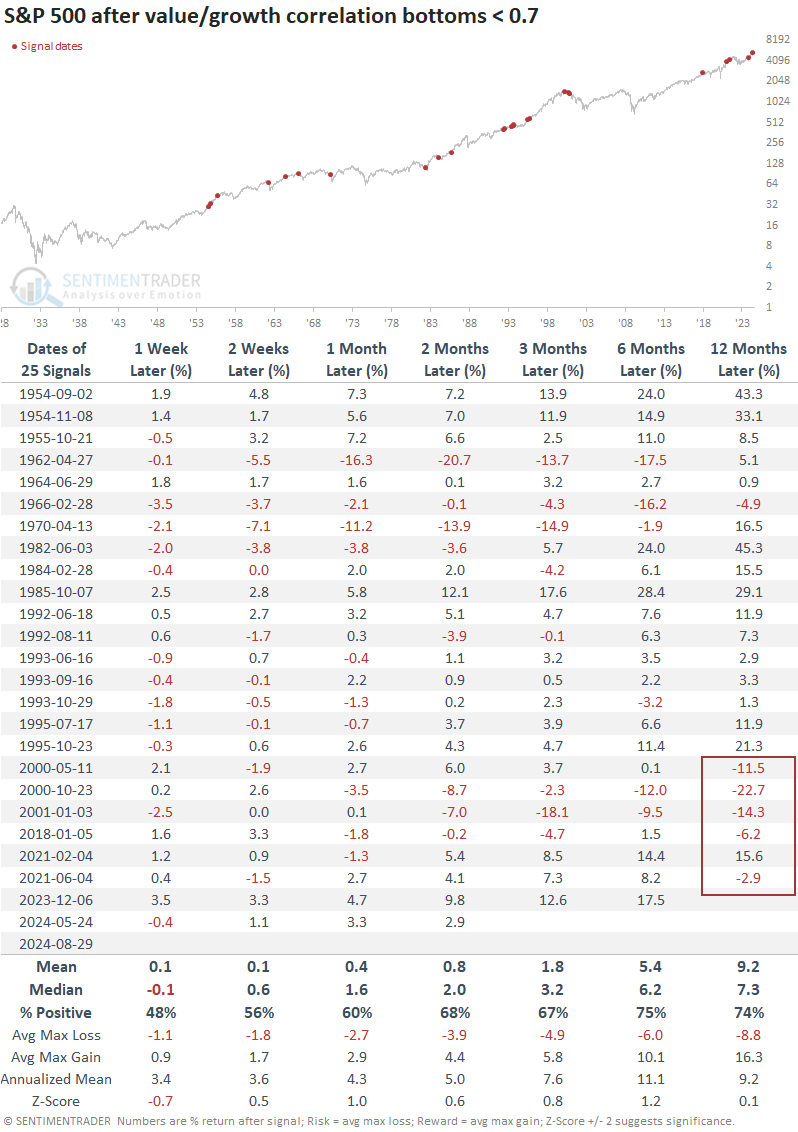
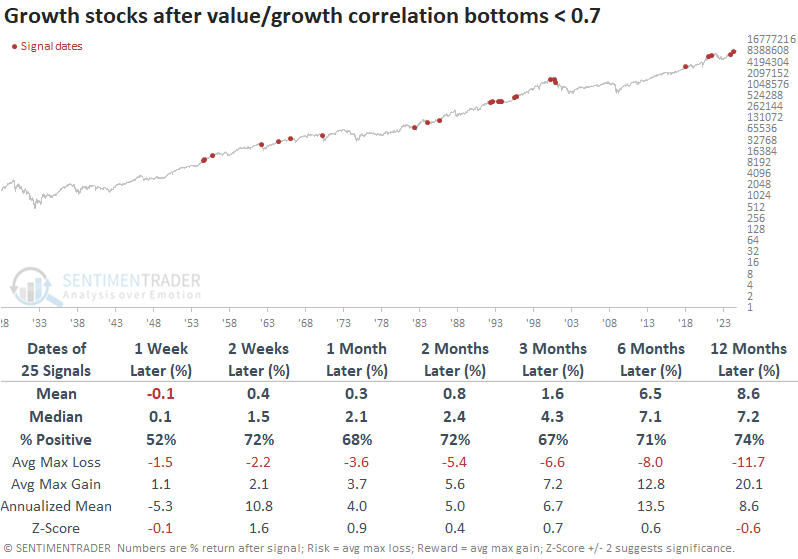
The table below shows each time since 1928 when the correlation between value and growth stocks bottomed below 0.7. The key word is "bottomed," and it's not fair to look at a chart to determine those points. We didn't know in real-time whether something was a bottom or not.

To make it more realistic, the table shows every time the correlation dropped below 0.7 and didn't make a lower low for one month. That's where we are now. Some of those did end up being the low for the cycle, but often did not; the correlation turned around and went to a lower low. Overall, it did not lead to dramatic trouble, except for one-year returns over the past 25 years.

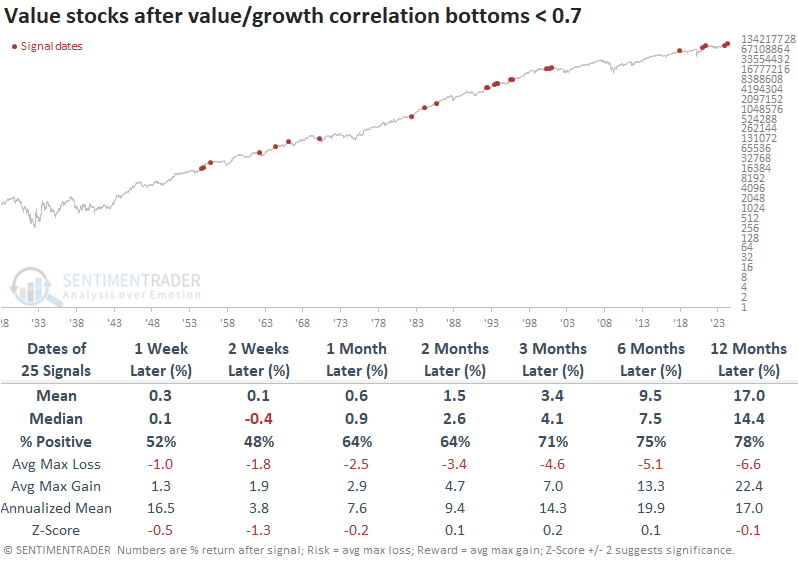
These were decent signals for value stocks. The median return over the next year was +14.4%, nearly double the S&P 500's median return, with lower risk and higher reward.

Growth stocks tended to rise less often over the medium- to long-term, and their average return was about half that of value stocks. In the short run, however, growth stocks tended to benefit more than value. The switch occurred at around the three-month mark.

What the research tells us...

Finding a relationship that looks ominous on a chart over a specific time frame is easy. Several equity market peaks over the past 25 years have similar qualities, leading investors to extrapolate those to all peaks. Markets aren't that easy, however, which is evident when we look at longer data series with larger sample sizes.

When value and growth divergence as much as they have over the past six months, it hasn't been a consistent negative for stocks. The biggest caveat to writing it off entirely is that over the past 25 years, it has preceded trouble more often than not. So, we have to determine whether recent history is more relevant, and that's an individual decision. The biggest takeaway is likely that value stocks have tended to perform significantly better than growth stocks and the broader market after troughs in the value/growth correlation.

PRODUCTS
SentimenTrader
Trading Tools
Indicators & Data API
‍
Strategies & Scanner
‍
Research Reports
FREE
RESOUrCES
Simple Backtest
Calculator
Simple Seasonality
Calculator
The Kelly Criterion
Calculator
Sentiment Geo Map
‍
Public Research Reports
‍
Education
Sentiment Indicators
‍
Technical Indicators
‍
Pricing
Bundle pricing
‍
FAQ
‍
Announcements
‍
COMPANY
‍
About
‍
In the News
‍
Testimonials
‍
Client Success Stories
CONTACT
‍
General Inquiries
‍
Media Inquiries
‍
Financial Professionals Inquiries
‍
© 2026 Sundial Capital Research Inc. All rights reserved.
Setsail Marketing
TermsPrivacyAffiliate Program
Risk Disclosure: The information and tools provided are for research and analytical purposes only and are not intended as investment advice. Market analysis involves uncertainty, and outcomes may differ from expectations. Users should conduct their own due diligence and consider their individual circumstances before making any financial decisions. Past performance is not necessarily indicative of future results.

Hypothetical Performance Disclosure: Hypothetical performance results have many inherent limitations, some of which are described below. No representation is being made that any account will or is likely to achieve profits or losses similar to those shown; in fact, there are frequently sharp differences between hypothetical performance results and the actual results subsequently achieved by any particular trading program. One of the limitations of hypothetical performance results is that they are generally prepared with the benefit of hindsight. In addition, hypothetical trading does not involve financial risk, and no hypothetical trading record can completely account for the impact of financial risk of actual trading. for example, the ability to withstand losses or to adhere to a particular trading program in spite of trading losses are material points which can also adversely affect actual trading results. There are numerous other factors related to the markets in general or to the implementation of any specific trading program which cannot be fully accounted for in the preparation of hypothetical performance results and all which can adversely affect trading results.

Testimonial Disclosure: Testimonials appearing on this website may not be representative of other clients or customers and is not a guarantee of future performance or success.