Products
SentimenTrader Trading Tools
‍
Backtest Engine
My Trading Toolkit
Correlation Analysis
Seasonality
Market Prediction
Indicators & Data API
‍
Proprietary Indicators & Charts
Market Data API
Strategies & Scanner
‍
50+ Trading Strategies
Smart Stock Scanner
Smart Option Scanner
Research Reports
‍
Research Solutions
Reports Library
Free Resources
Simple Backtest Calculator
Simple Seasonality Calculator
The Kelly Criterion Calculator
Sentiment Geo Map
Public Research Reports
Education
Sentiment Indicators
Technical Indicators
Pricing
Company
About
In the News
Testimonials
Client Success Stories
Contact
Log inLoginSign up
< BACK TO ALL REPORTS

A broad breakout in recovery stocks

Jason Goepfert
2021-02-26
At least 25% of members of recovery sectors like energy, financials, industrials, and materials have just hit a 52-week high.

Earlier this week, financial stocks enjoyed a broad breakout, with nearly 30% of stocks in the sector breaking out to at least a 52-week high.

It's only gotten better from there. And they've been joined by a bunch of recovery-sector buddies, too.

Among all indexes and sectors, the four horsemen of a recovery - Energy, Financials, Industrials, and Materials - are leading the charge. At least 30% of member stocks in all four of those sectors reached a new high on Wednesday. That's among the most impressive breakouts in 70 years for sectors geared to an economic recovery.

Energy financial industrial material stocks at 52 week high

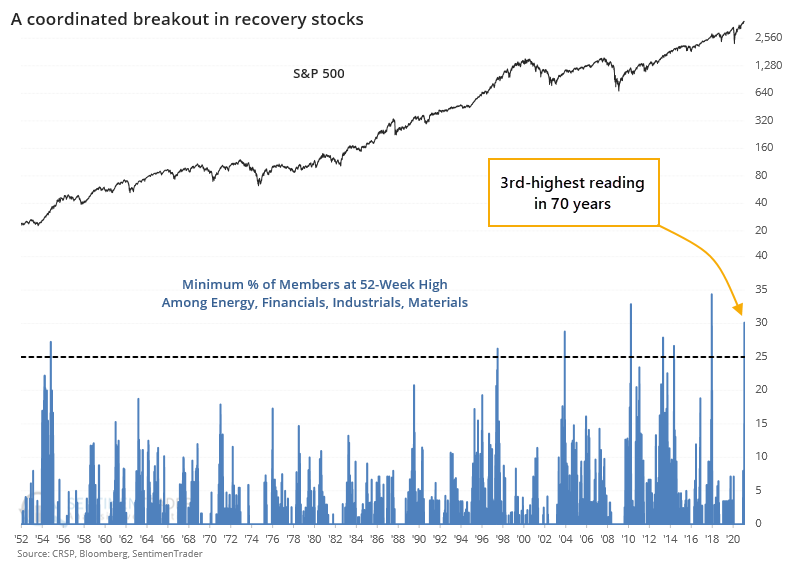
When we look at other times when there was such a coordinated breakout among these sectors, we see that often it was too much of a good thing, at least for a while. And it impacted Industrial and Material stocks much more than the other two.

What else we're looking at

  • Full returns in the S&P 500 and sectors when there is a big breakout in "recovery" stocks
  • What happens when TLT gets oversold
  • A close look at the "bubble" in the VIX fear gauge
  • A seasonal look at consumer discretionary stocks
  • The Composite Confirmation Model has turned positive - what that suggests for the next 3 months

Stat Box

More than 50% of financial stocks hit a 52-week high this week. That has happened on 18 other days in the past 20 years, leading to an average 1-month return of -0.33% according to our Backtest Engine.


Sentiment from other perspectives

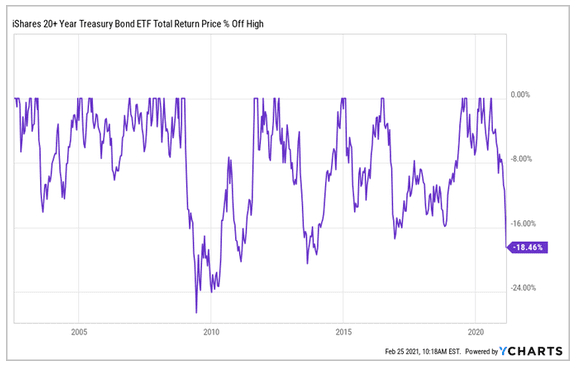
Some crazy moves. The bond market suffered a mini-breakdown on Thursday, and it was enough to trigger one of the largest drawdowns from a peak in the history of TLT, the go-to bond ETF for many investors. Source: Ycharts via Daily Shot

tlt drawdown

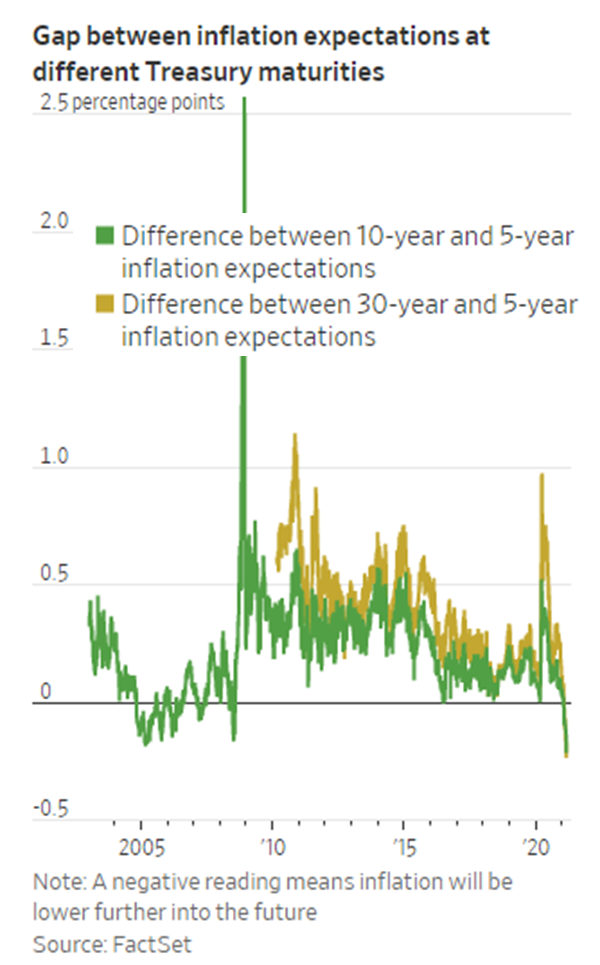
Thanks, inflation. The bond market gyrations are due to a sudden spike in concern about inflation. But it's only in the shorter-term, with longer-term worries about inflation still on the back burner. Source: Wall Street Journal

inflation expectations

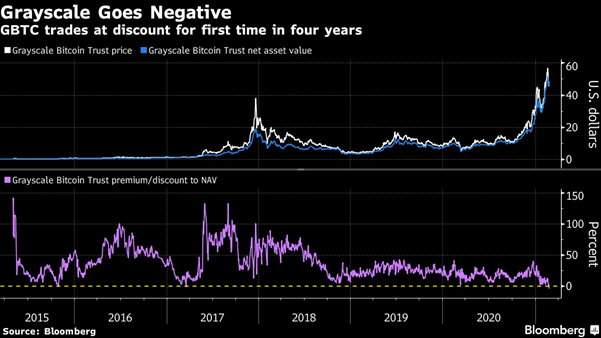
Even bitcoin's getting weird. The recent bout of volatility was enough to push GBTC, the go-to bitcoin fund, to a discount relative to its underlying assets. The fund hasn't given investors the chance to buy the coin at a discount in 4 years. Source: Bloomberg

gbtc discount

PRODUCTS
SentimenTrader
Trading Tools
Indicators & Data API
‍
Strategies & Scanner
‍
Research Reports
FREE
RESOUrCES
Simple Backtest
Calculator
Simple Seasonality
Calculator
The Kelly Criterion
Calculator
Sentiment Geo Map
‍
Public Research Reports
‍
Education
Sentiment Indicators
‍
Technical Indicators
‍
Pricing
Bundle pricing
‍
FAQ
‍
Announcements
‍
COMPANY
‍
About
‍
In the News
‍
Testimonials
‍
Client Success Stories
CONTACT
‍
General Inquiries
‍
Media Inquiries
‍
Financial Professionals Inquiries
‍
© 2026 Sundial Capital Research Inc. All rights reserved.
Setsail Marketing
TermsPrivacyAffiliate Program
Risk Disclosure: The information and tools provided are for research and analytical purposes only and are not intended as investment advice. Market analysis involves uncertainty, and outcomes may differ from expectations. Users should conduct their own due diligence and consider their individual circumstances before making any financial decisions. Past performance is not necessarily indicative of future results.

Hypothetical Performance Disclosure: Hypothetical performance results have many inherent limitations, some of which are described below. No representation is being made that any account will or is likely to achieve profits or losses similar to those shown; in fact, there are frequently sharp differences between hypothetical performance results and the actual results subsequently achieved by any particular trading program. One of the limitations of hypothetical performance results is that they are generally prepared with the benefit of hindsight. In addition, hypothetical trading does not involve financial risk, and no hypothetical trading record can completely account for the impact of financial risk of actual trading. for example, the ability to withstand losses or to adhere to a particular trading program in spite of trading losses are material points which can also adversely affect actual trading results. There are numerous other factors related to the markets in general or to the implementation of any specific trading program which cannot be fully accounted for in the preparation of hypothetical performance results and all which can adversely affect trading results.

Testimonial Disclosure: Testimonials appearing on this website may not be representative of other clients or customers and is not a guarantee of future performance or success.