Products
SentimenTrader Trading Tools
‍
Backtest Engine
My Trading Toolkit
Correlation Analysis
Seasonality
Market Prediction
Indicators & Data API
‍
Proprietary Indicators & Charts
Market Data API
Strategies & Scanner
‍
50+ Trading Strategies
Smart Stock Scanner
Smart Option Scanner
Research Reports
‍
Research Solutions
Reports Library
Free Resources
Simple Backtest Calculator
Simple Seasonality Calculator
The Kelly Criterion Calculator
Sentiment Geo Map
Public Research Reports
Education
Sentiment Indicators
Technical Indicators
Pricing
Company
About
In the News
Testimonials
Client Success Stories
Contact
Log inLoginSign up
< BACK TO ALL REPORTS

A breakout with bullish implications for stocks

Dean Christians
2022-11-08
The Investment Banking and Brokerage Sub-Industry closed at a new 126-day high but not a 252-day. After similar base breakouts, the industry and the broad market had a positive upward bias.

Key points:

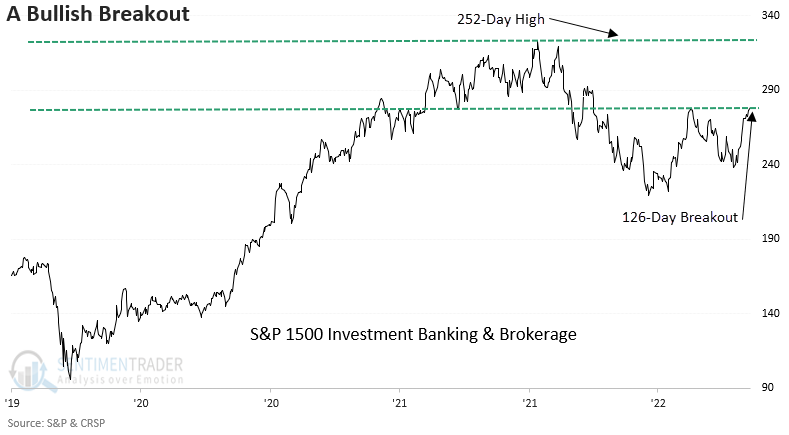
  • The Investment Banking & Brokerage Sub-Industry group closed at a new 126-day high
  • However, the group did not close at a 252-day high
  • After similar base breakouts, the Sub-Industry and the S&P 500 had a positive upward bias

Financials are a systemically important sector

On Monday, the Investment Banking & Brokerage Sub-Industry closed at a new 126-day but not a 252-day high. The breakout is an interesting development for an industry that suffers in volatile periods like now, as deal flow across the capital markets tends to slow.  

So, with financials outperforming this year and the Investment Banking and Brokerage Sub-Industry group breaking out to a new high, what can we learn from the message of the market?

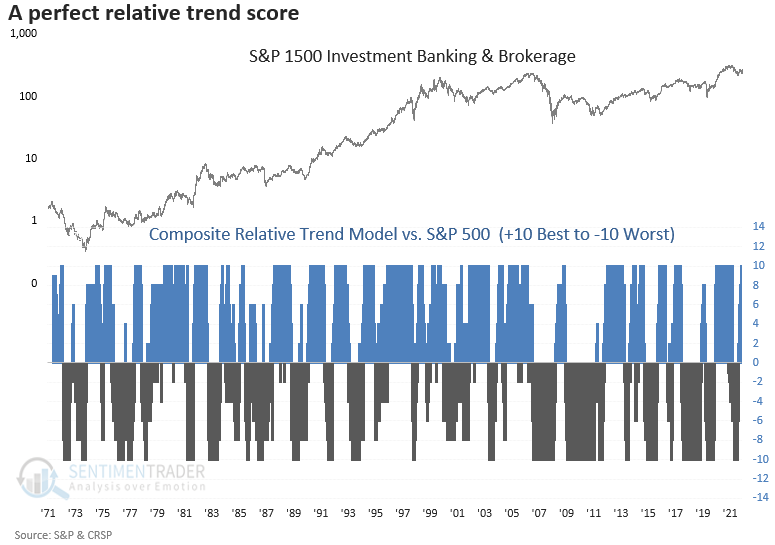
At the same time that the Investment Banking and Brokerage group is breaking out on an absolute basis, the index is outperforming on a relative basis. My composite relative trend model maintains a perfect score. 

Similar breakouts preceded positive returns

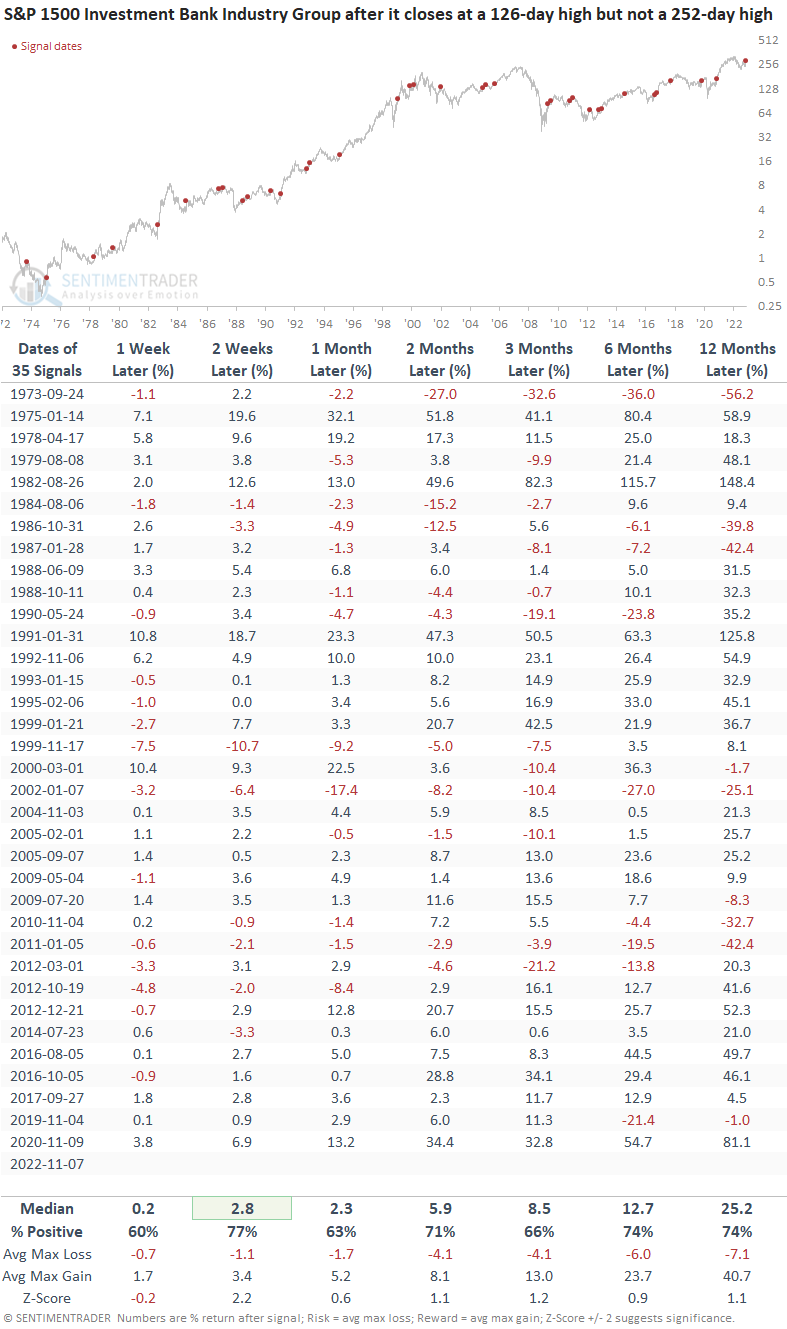
When the Investment Banking and Brokerage Sub-Industry Group closes at a 126-day high but not a 252-day high, the bullish price pattern tends to foreshadow positive returns across all time frames. 

The signal shows 31 out of 35 winners at some point in the first two months.

While long-term results are solid, a handful of significant drawdowns are worth noting, especially in 1973 and 2002.

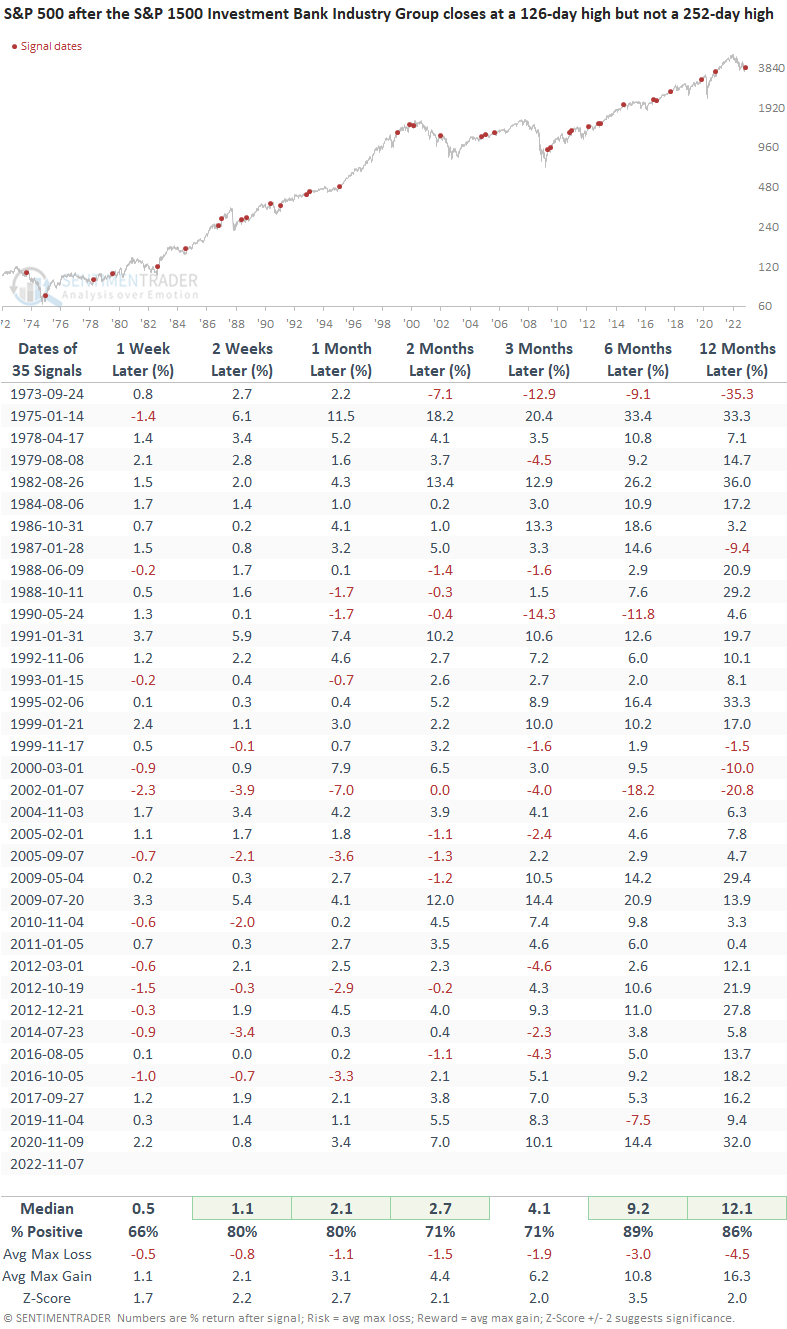
Returns, win rates, and z-scores look even better when I apply the signals to the S&P 500. So, what's good for a component within financials is good for the broad market. 

What the research tells us...

The Investment Banking and Brokerage Sub-Industry group closed at a new 126-day high but not a 252-day high. While the outlook for the industry and the broad market looks constructive, we must be mindful that the breakout is unusual as the group tends to suffer in volatile market periods. The two most noteworthy bear market signals occurred in 1973 and 2002. Interestingly, both periods share similar factors with the current environment. Valuation, inflation, and monetary policy were all headwinds.

PRODUCTS
SentimenTrader
Trading Tools
Indicators & Data API
‍
Strategies & Scanner
‍
Research Reports
FREE
RESOUrCES
Simple Backtest
Calculator
Simple Seasonality
Calculator
The Kelly Criterion
Calculator
Sentiment Geo Map
‍
Public Research Reports
‍
Education
Sentiment Indicators
‍
Technical Indicators
‍
Pricing
Bundle pricing
‍
FAQ
‍
Announcements
‍
COMPANY
‍
About
‍
In the News
‍
Testimonials
‍
Client Success Stories
CONTACT
‍
General Inquiries
‍
Media Inquiries
‍
Financial Professionals Inquiries
‍
© 2026 Sundial Capital Research Inc. All rights reserved.
Setsail Marketing
TermsPrivacyAffiliate Program
Risk Disclosure: The information and tools provided are for research and analytical purposes only and are not intended as investment advice. Market analysis involves uncertainty, and outcomes may differ from expectations. Users should conduct their own due diligence and consider their individual circumstances before making any financial decisions. Past performance is not necessarily indicative of future results.

Hypothetical Performance Disclosure: Hypothetical performance results have many inherent limitations, some of which are described below. No representation is being made that any account will or is likely to achieve profits or losses similar to those shown; in fact, there are frequently sharp differences between hypothetical performance results and the actual results subsequently achieved by any particular trading program. One of the limitations of hypothetical performance results is that they are generally prepared with the benefit of hindsight. In addition, hypothetical trading does not involve financial risk, and no hypothetical trading record can completely account for the impact of financial risk of actual trading. for example, the ability to withstand losses or to adhere to a particular trading program in spite of trading losses are material points which can also adversely affect actual trading results. There are numerous other factors related to the markets in general or to the implementation of any specific trading program which cannot be fully accounted for in the preparation of hypothetical performance results and all which can adversely affect trading results.

Testimonial Disclosure: Testimonials appearing on this website may not be representative of other clients or customers and is not a guarantee of future performance or success.