
A breakout and momentum surge bodes well for technology

Key points:
- The S&P 500 Technology sector and the Nasdaq 100 closed at new highs
- Initial breakouts from prior major troughs resulted in powerful advances in both indexes
- These same indices showed strengthening price momentum, triggering deviation from trend alerts
- Similar signals yielded outstanding returns and consistency for technology stocks
Two widely followed technology indices reached a new high, with improving momentum
The S&P 500 Technology sector and the Nasdaq 100, two of the most closely watched technology indices, closed at new highs, joining the Industrials sector, which Jason highlighted in a recent report.
While breakouts are a common phenomenon during bull markets, it's noteworthy that these are the first new highs following significant pullbacks. Specifically, the S&P 500 Technology sector reached a new high after rebounding from a 1-year low, and the Nasdaq 100 achieved its breakout after emerging from a 9-month low.
As shown in the table below, most of the other groups hitting new highs are in the technology sector. Interestingly, the equal-weighted S&P 500 Communication Services sector also closed at a new high, suggesting that strength isn't limited to mega-cap stocks like Meta, Netflix, and Alphabet.
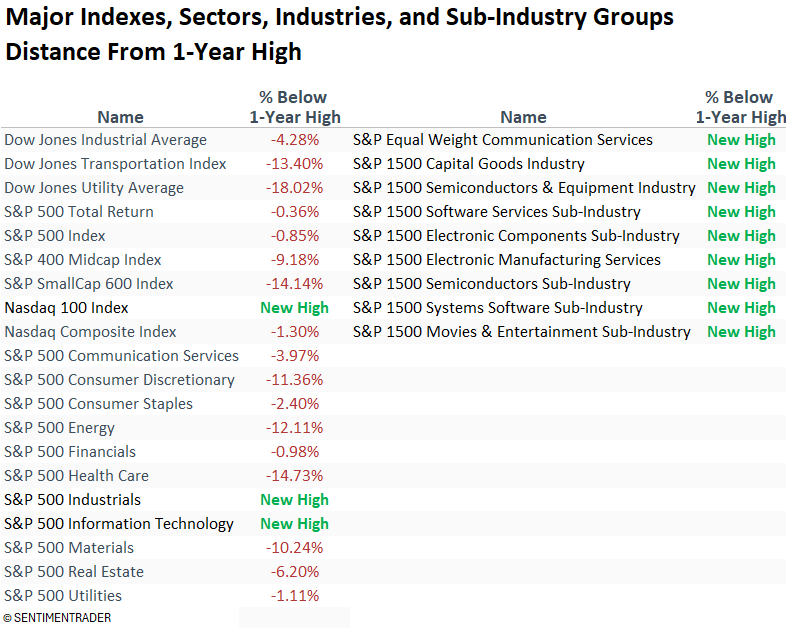
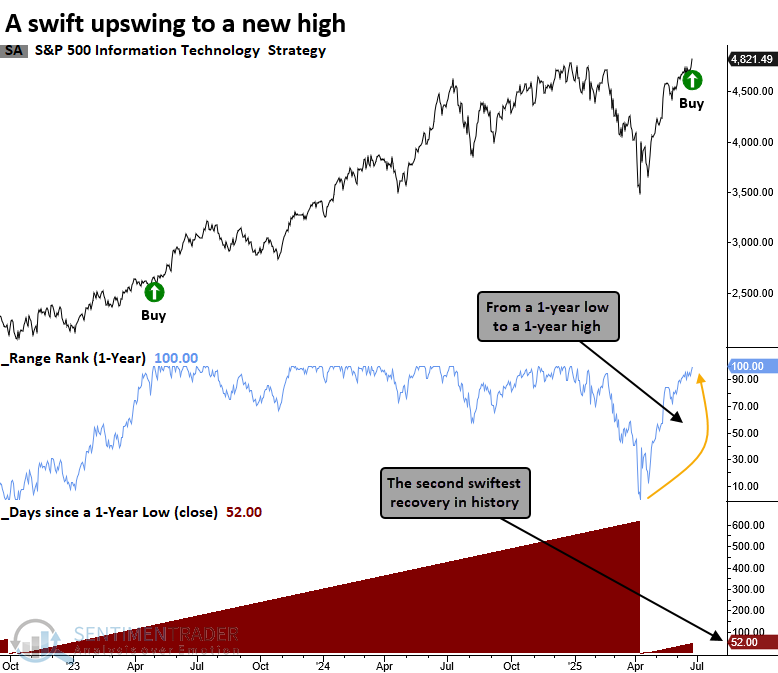
The S&P 500 Technology sector transitioned from a 1-year low to a 1-year high in just 52 sessions, marking the second-fastest rebound on record, surpassed only by a recovery in 1978.
Similar price recoveries suggest a sustainable uptrend
Whenever the S&P 500 Technology sector cycled from a 1-year low to a 1-year high, it advanced over the next month in 93% of cases, an encouraging sign that suggests upside follow-through as a favorable seasonal period approaches.
Although a few instances showed weakness over the medium term, the sector was higher a year later in all but two cases.
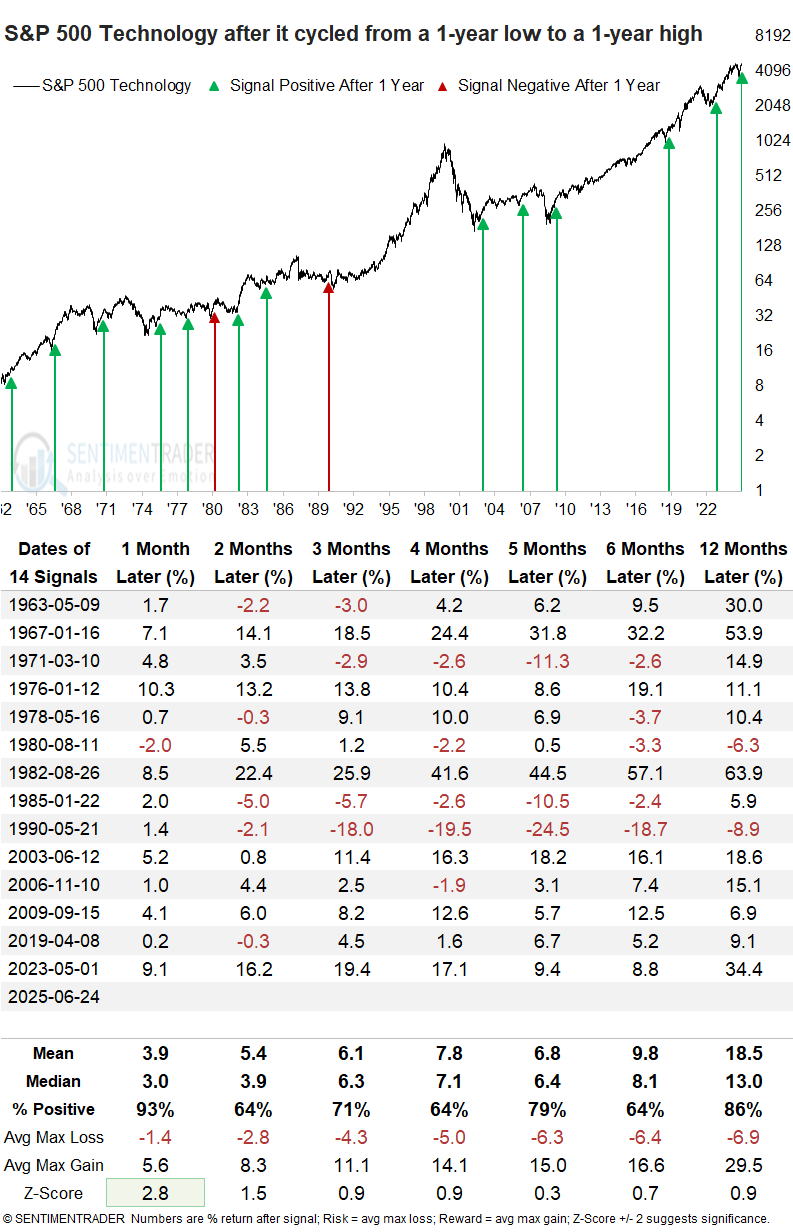
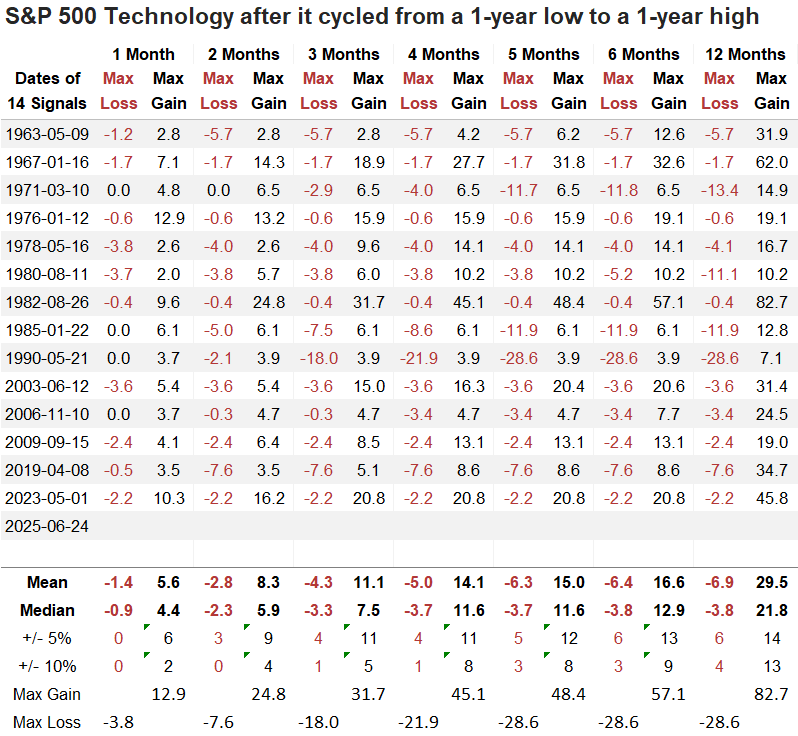
A year later, the S&P 500 Technology sector declined more than 10% only four times. In contrast, it posted rallies of over 10% in 13 cases, suggesting a favorable risk/reward scenario.
In just 52 trading sessions, the Nasdaq 100 climbed from a 9-month low to a 1-year high, posting its second-fastest recovery on record, eclipsed only by the rebound seen in 1989.
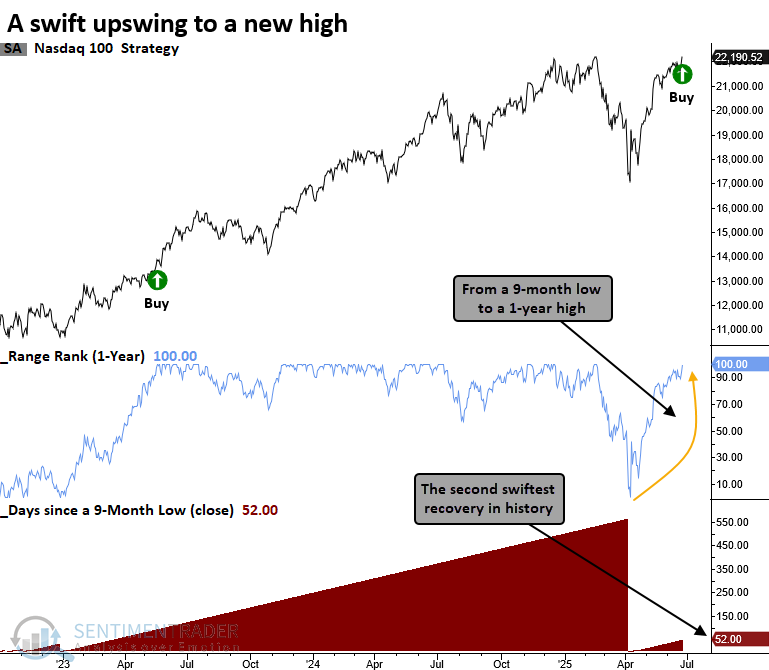
Whenever the Nasdaq 100 cycled from a 9-month low to a 1-year high, the popular tech-heavy index advanced without fail over the following year.
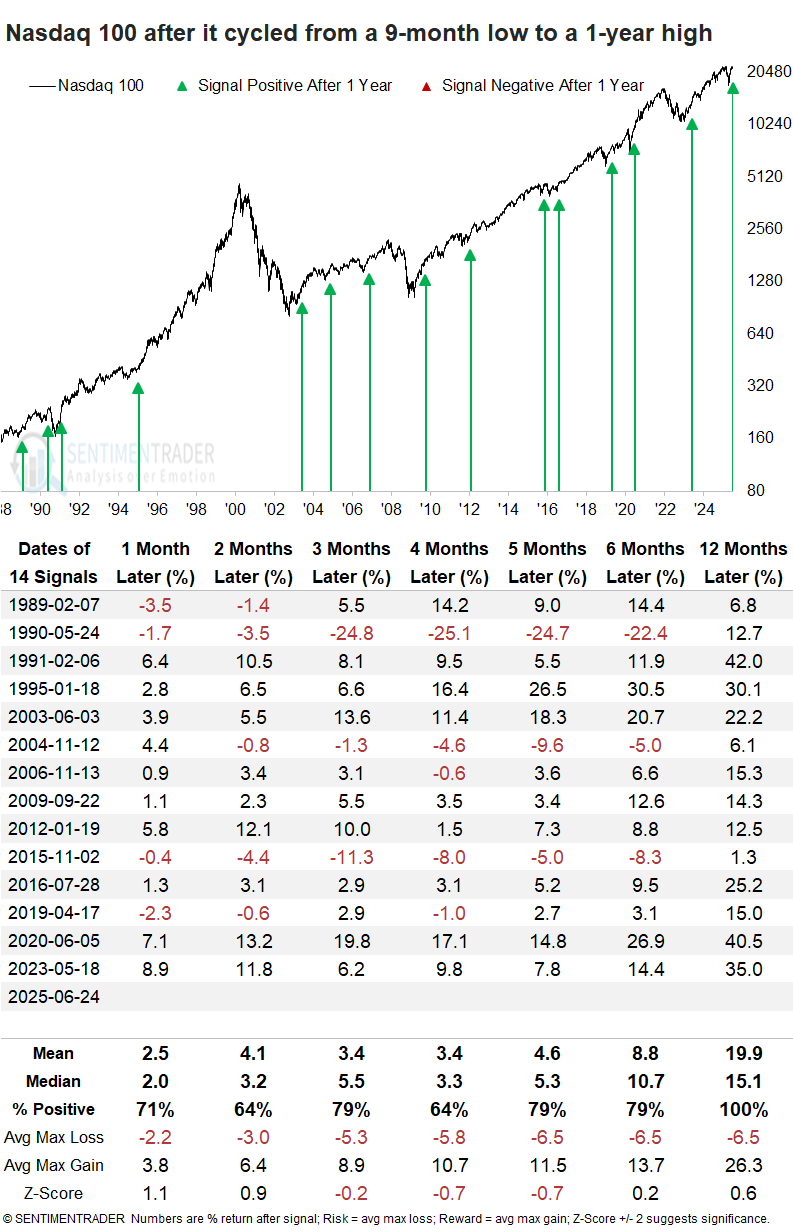
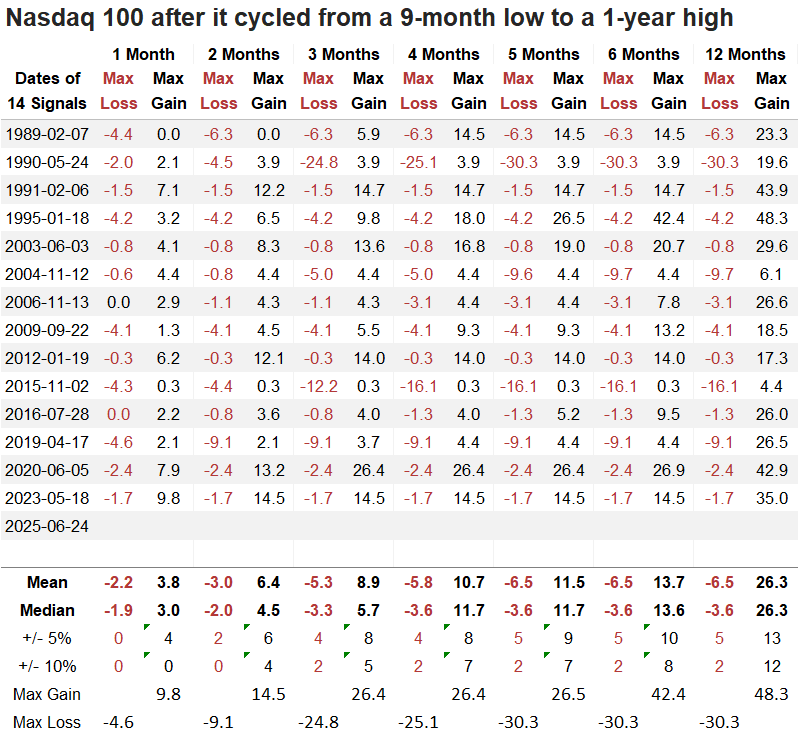
In the following year, the Nasdaq 100 fell by more than 10% on just two occasions, yet it rallied by over 10% twelve times, indicating an attractive risk-reward profile.
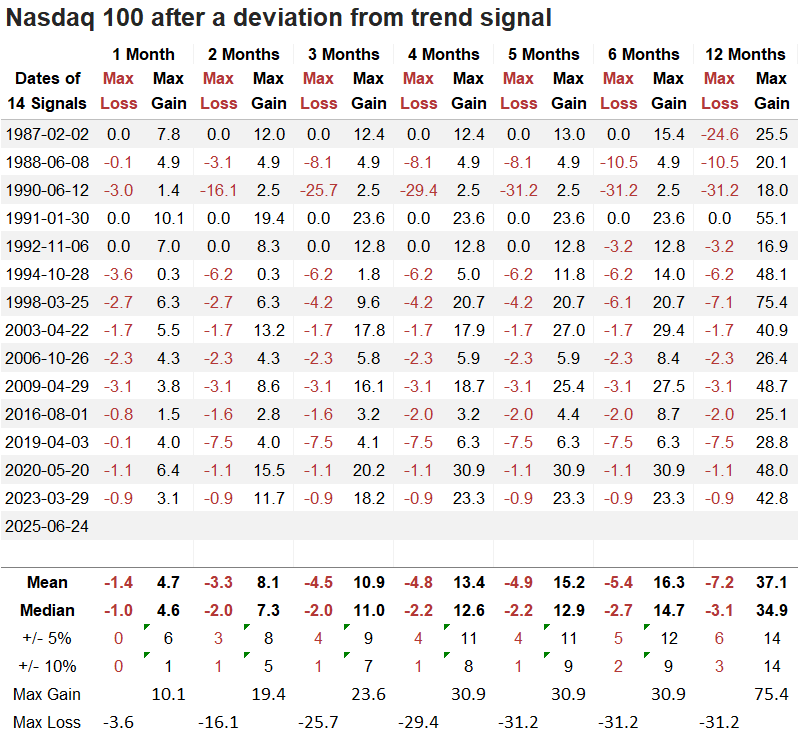
Technology indexes exhibit bullish price momentum
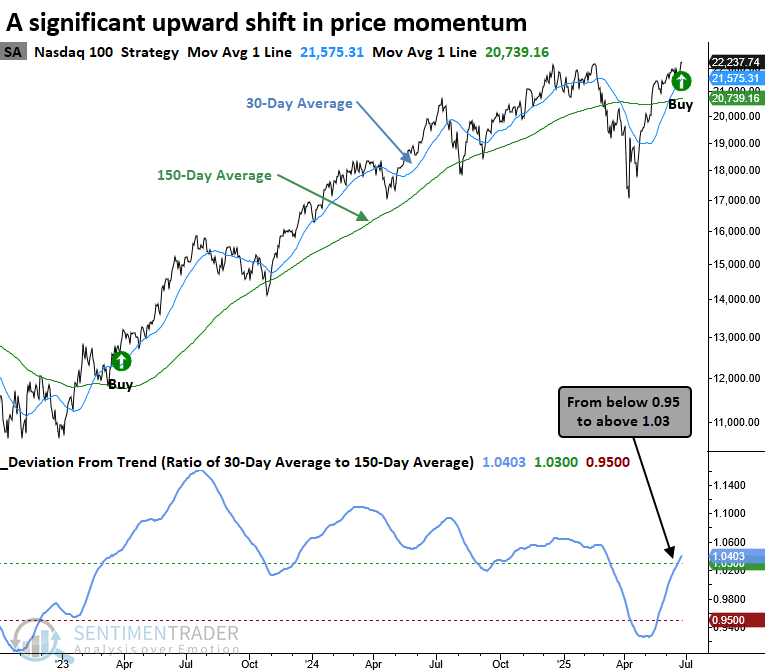
The Deviation from Trend indicator identifies momentum shifts by tracking the ratio of the 30-day to 150-day average. A signal occurs when the ratio cycles from below 0.95 to above 1.03, and the index registers a 42-day high.
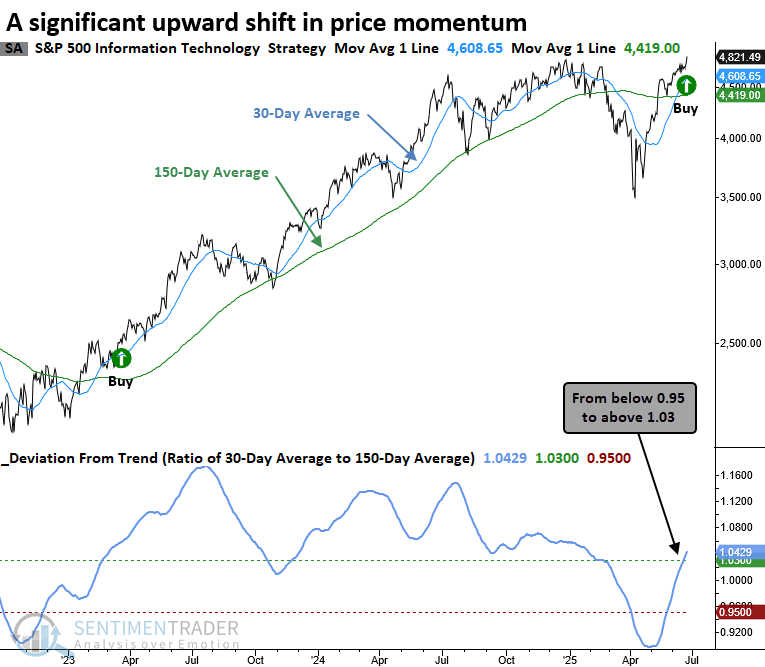
An upward shift in price momentum, as measured by the deviation from trend indicator, tended to produce outstanding returns and consistency for the S&P 500 Technology sector over the subsequent year, with several horizons exhibiting significance relative to random returns.
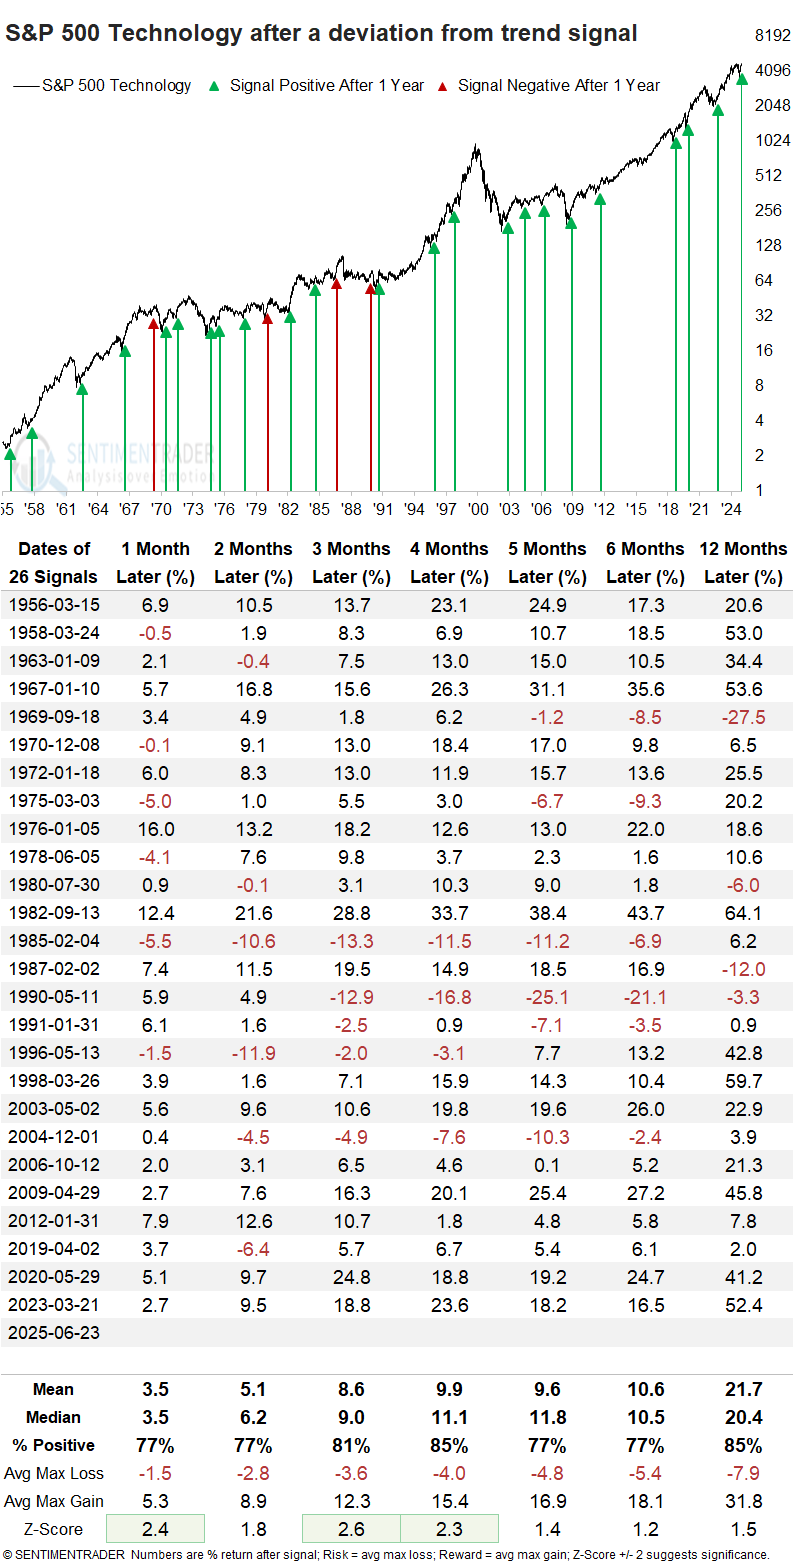
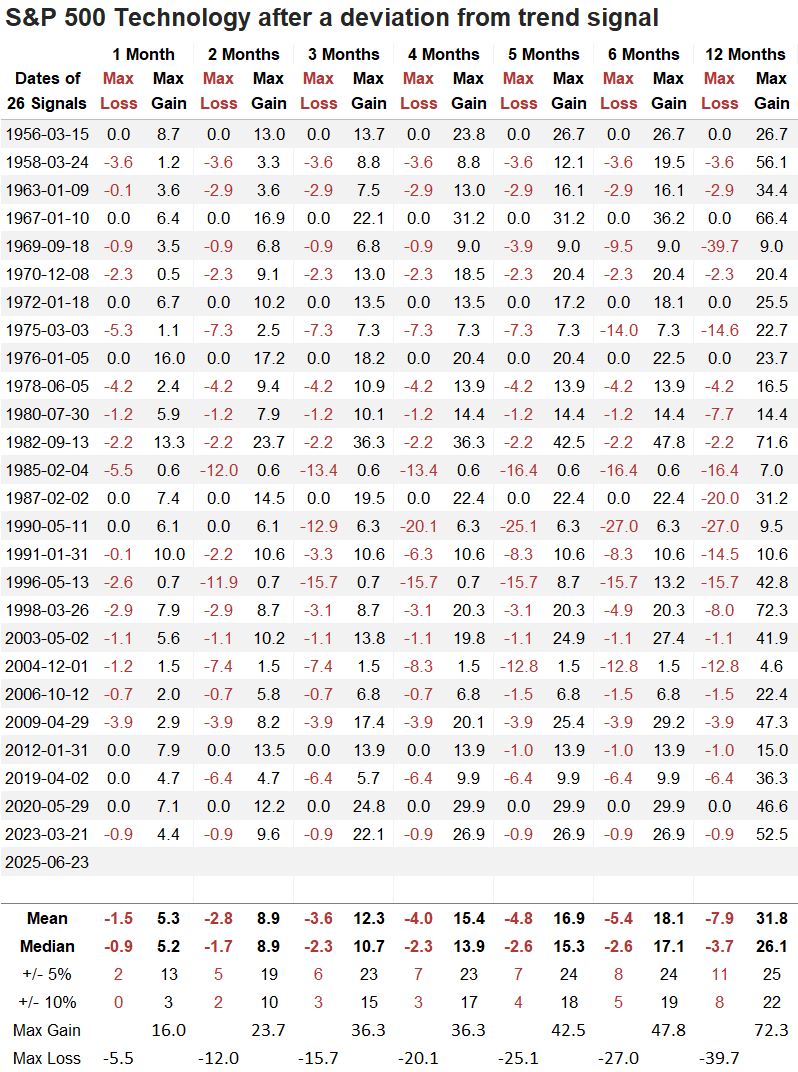
Over the next year, the S&P 500 Technology sector declined by more than 10% on eight occasions, while it rallied by more than 10% 22 times, underscoring a compelling risk-reward profile.
The Nasdaq 100 generated a deviation from trend alert when the indicator cycled from below 0.95 to above 1.03 and closed at a 42-day high.
When price momentum shifted upward, as captured by the deviation from trend indicator, it consistently led to strong forward returns in the Nasdaq 100 over the following year, with the one- and twelve-month intervals registering only one loss and displaying significance relative to random expectations.
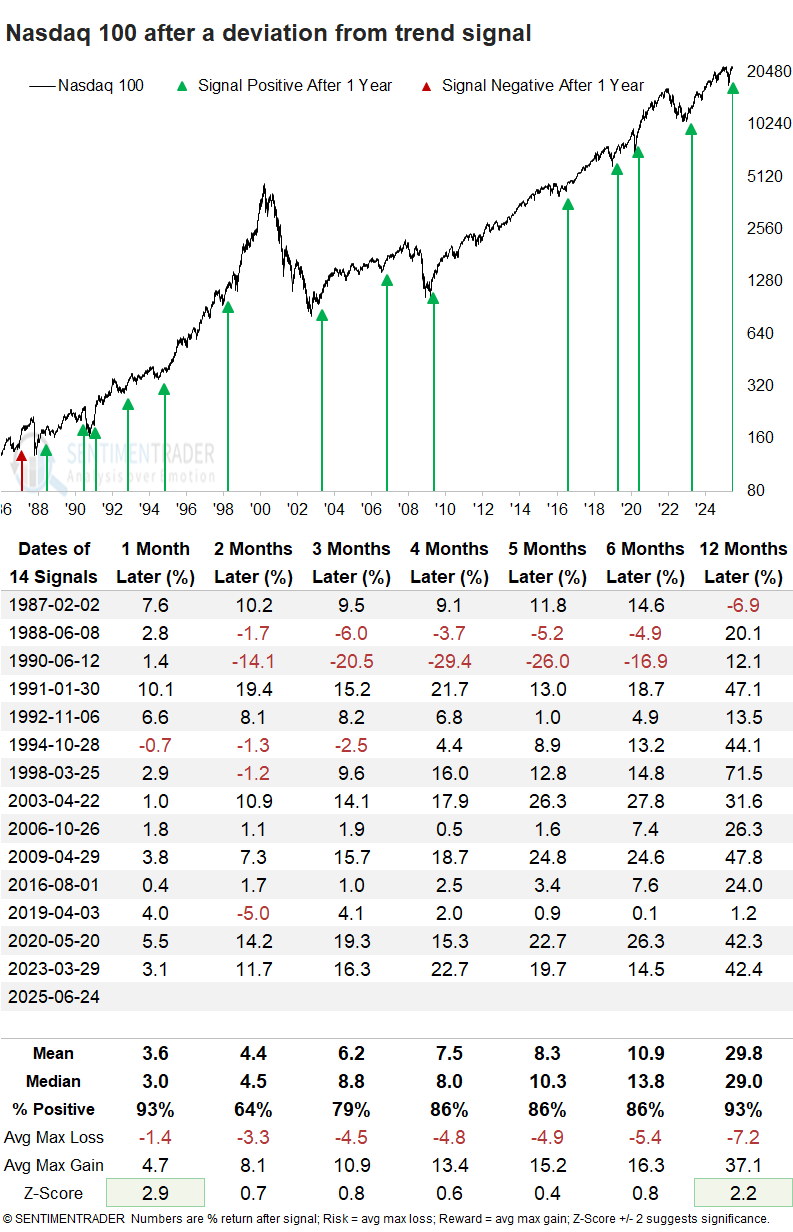
In the year that followed, the Nasdaq 100 dropped by more than 10% three times, yet it surged by over 10% on 14 occasions, indicating an attractive risk-reward setup.
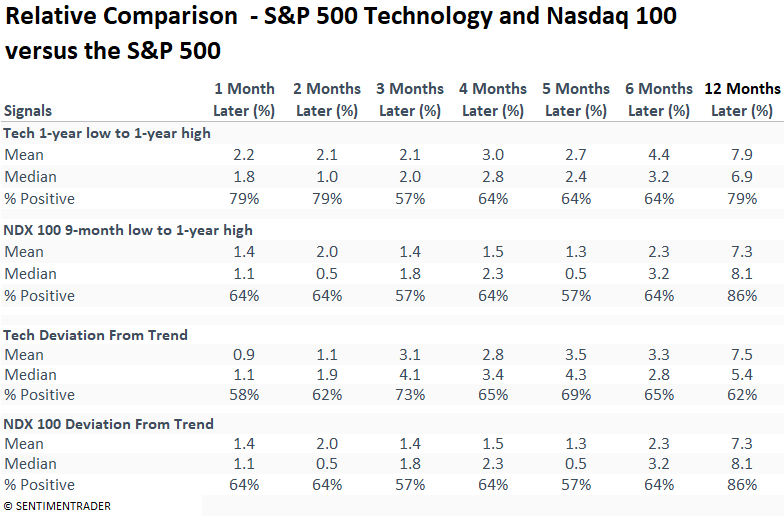
Both signals outperformed the S&P 500 across all measured time frames, with win rates ranging from 57% to an impressive 86%, reinforcing the case for maintaining an overweight position in technology.
What the research tells us...
Both the S&P 500 Technology sector and the Nasdaq 100 closed at new highs, marking their first such milestones following significant drawdowns. In past instances when the Technology sector reached a new high after a one-year low, it continued to rally over the next year 86% of the time. The record is even more compelling for the Nasdaq 100, which has advanced 100% of the time a year after similar post-drawdown new highs have been reached. Price momentum signals were also triggered in each index, further strengthening the argument that a sustainable advance is underway for these technology benchmarks, which have historically outperformed the broader market under similar scenarios.