
A breadth thrust signal in financials suggests higher prices

Key points:
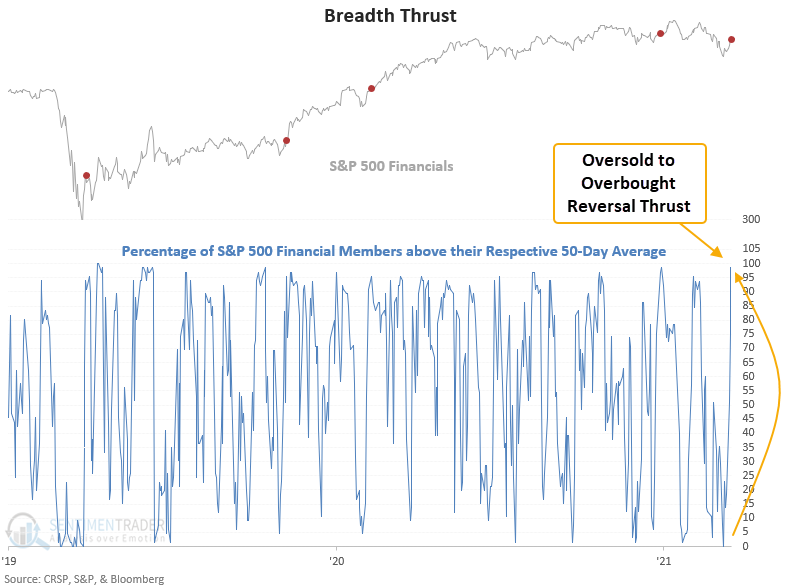
- S&P 500 Financial members above the 10-day average surged from 0% to 98%
- It took fewer than 7 sessions to go from oversold to overbought
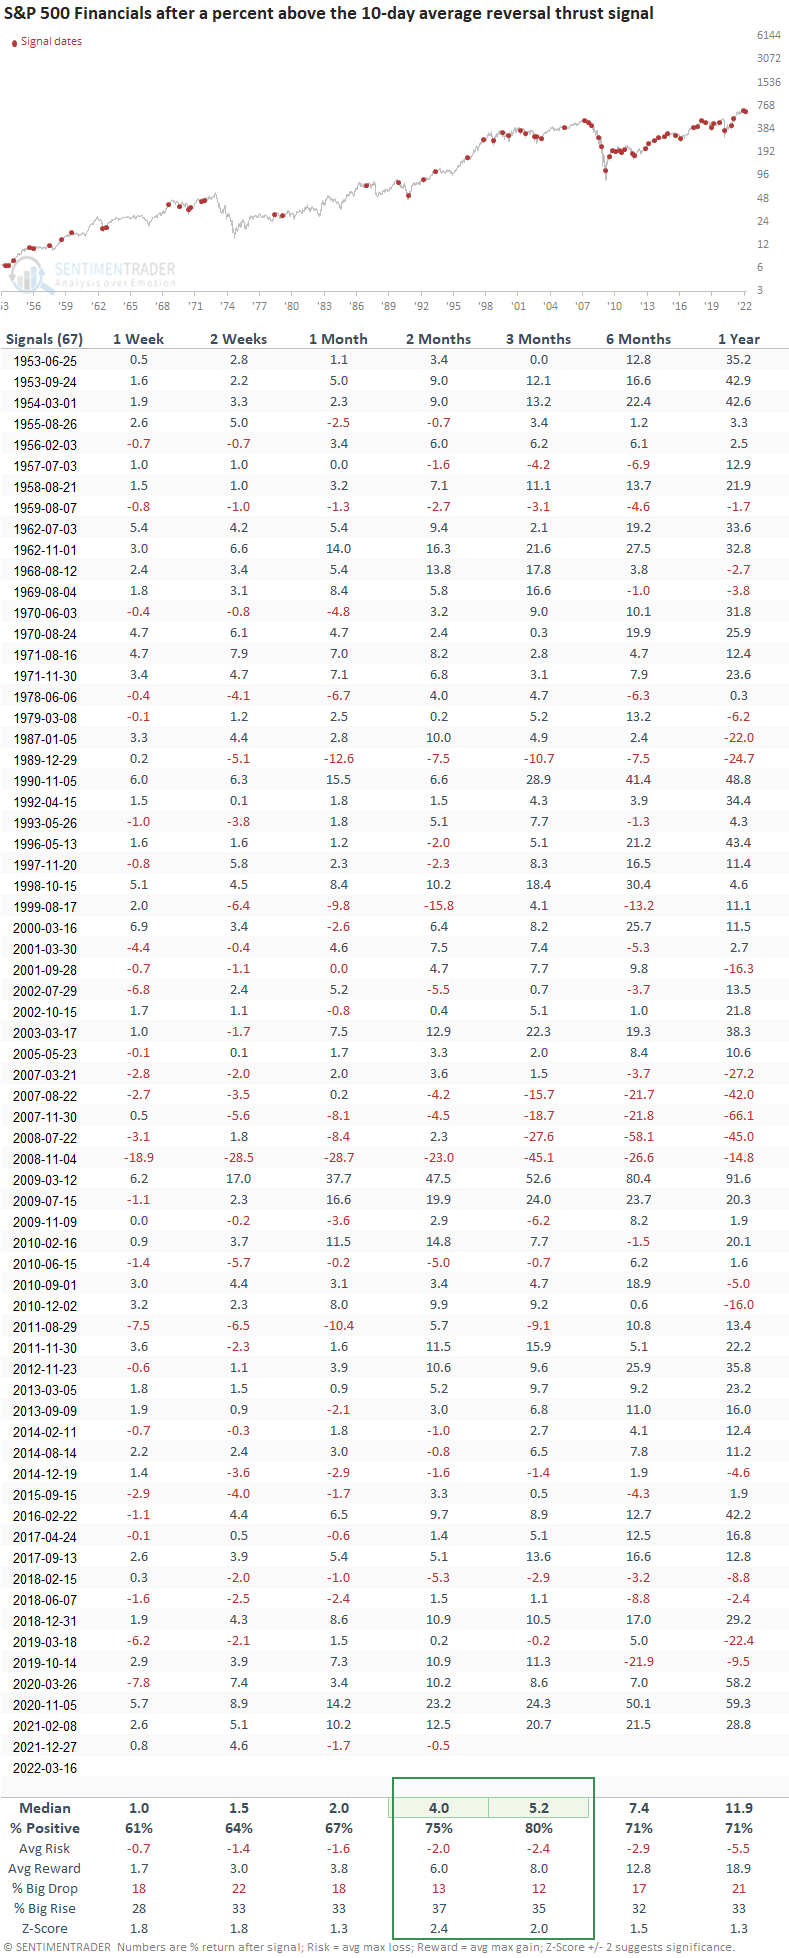
- The sector rallied 80% of the time after other signals
A short duration breadth indicator reverses higher
The percentage of members above the 10-day reversal model is a component in the TCTM Thrust model. I shared the concept in a note on 3/29/21 and a new trading signal for the S&P 500 on 12/9/21. I also monitor the alert for other indexes and sectors as I'm a big fan of breadth-based momentum signals.
The percentage of members above the 10-day average model identifies when the number of members trading above the 10-day moving average cycles from oversold to overbought in a short period. The financials version requires a reversal from < 9% to > 91% in 7 sessions or fewer.
Sharp and sudden upward shifts in participation are historically bullish
The 10-day average reversal signal triggered 4 other times since the pandemic low. All four signals were profitable 2 weeks later. However, we need to remember that the alerts occurred with a friendly Fed.
Similar breadth reversals preceded gains 80% of the time
This signal triggered 67 other times over the past 69 years. After the others, the sector's future returns, win rates, and risk/reward profiles were solid across all time frames. The 2 and 3 month time frames provide the best outlook for a medium-term trade idea, with excellent performance post the GFC bottom and during the high inflation 1970s environment.
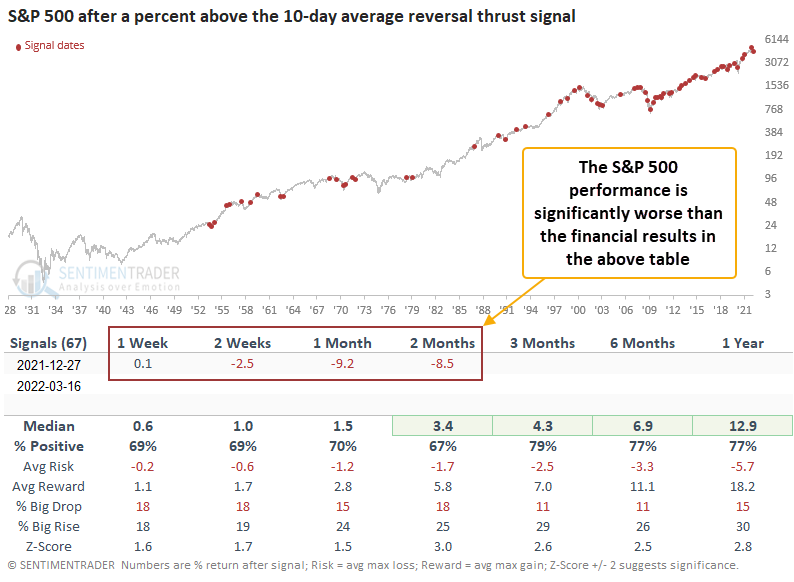
Broad market performance looks solid after a financials thrust signal
Financials are an important group as they typically foreshadow credit problems around significant market peaks. So, the new thrust signal is a welcome development for the broad market. Even if the S&P 500 struggles on a go-forward basis, the previous instance shows that financials can outperform on a relative basis.
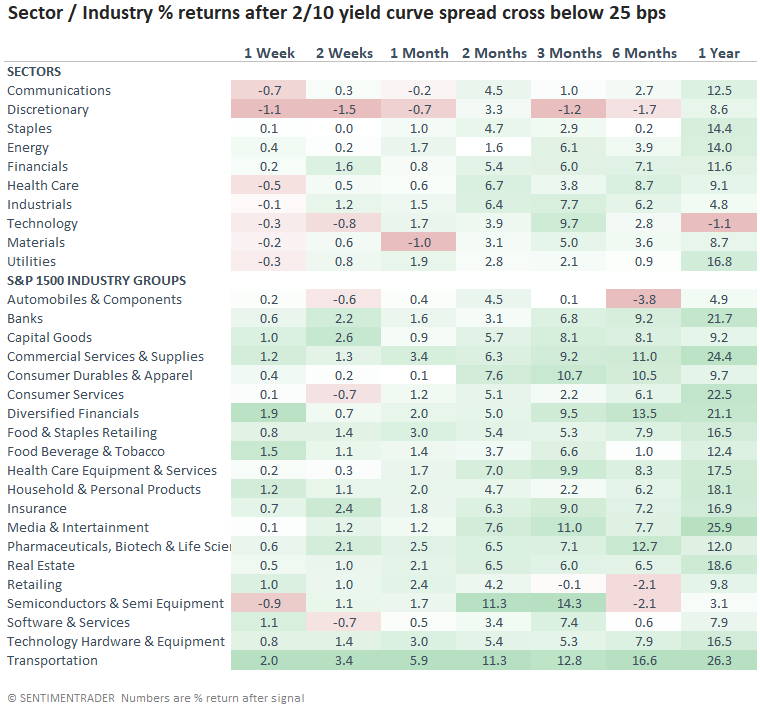
Should we be concerned about financials with the yield curve so low
The 2/10s yield curve crossed below 25 basis points on 3/7/22. The low level does not spell doom and gloom for financials, banks, and diversified financials. The same can't be said for discretionary stocks.
Signals started in 1978, and I used a reset above 120 bps to identify the first cross below 25 bps.
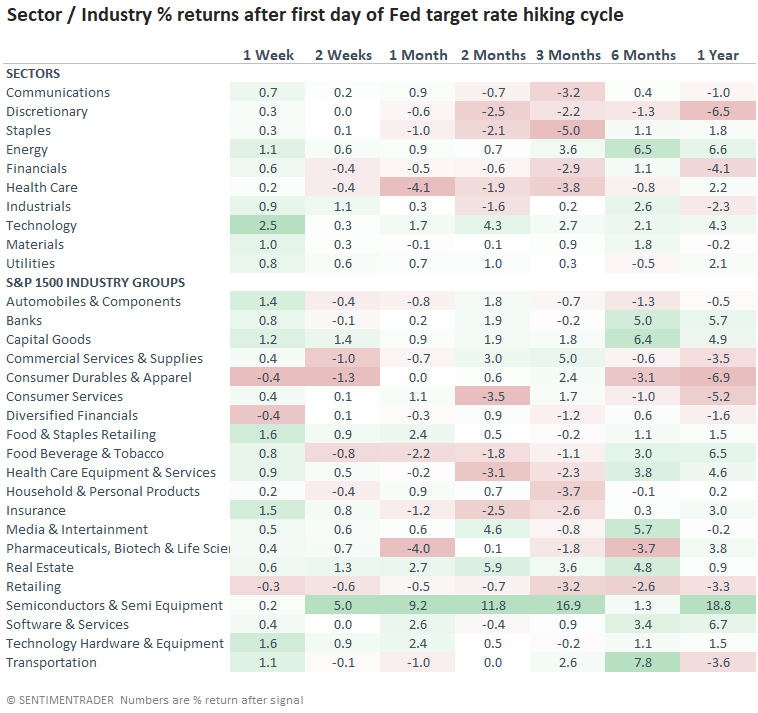
Should we be concerned about financials after the first Fed rate hike
The first Fed rate hike signals suggest a cautionary outlook for financials and the broad market. So, if we felt compelled to put a new trade on, I would keep a short leash on the idea.
The first-rate hike signals started in 1972.
 What the research tells us...
When the percentage of S&P 500 Financial sector members trading above their respective 10-day moving average reverses from oversold to overbought in 7 sessions or fewer, financials continue to rise. Similar setups to what we're seeing now have preceded solid returns, win rates, and risk/reward profiles across all time frames, especially in the 3-month window. While the current level of the yield curve is not a concern, the first Fed rate hike outlook suggests caution.