
A breadth composite triggered a buy signal for Technology

Key points:
- A breadth composite for the S&P 500 Technology sector triggered a buy signal
- Comparable breadth-based alerts preceded a favorable backdrop for the sector
- Although relative trend scores for the Technology sector are negative, opportunities exist in specific groups
Technology breadth gets back in gear, suggesting a more favorable environment
I'm a huge proponent of versatile indicators, such as the Risk On/Off indicator, which I discussed in my research note on Monday. Breadth composite indicators also fit into this category, offering users the flexibility to develop either a standalone trading signal, strategy, or system overlay for other models.
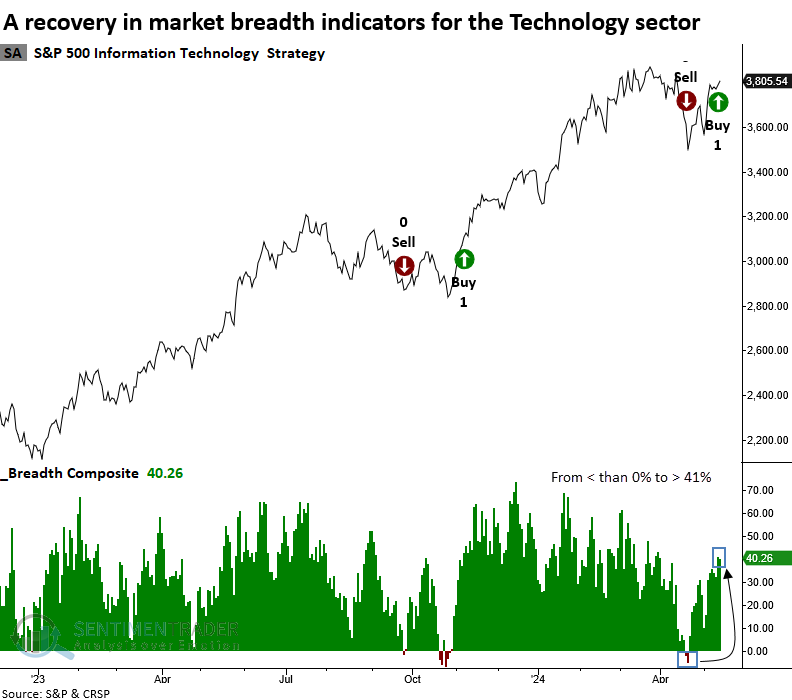
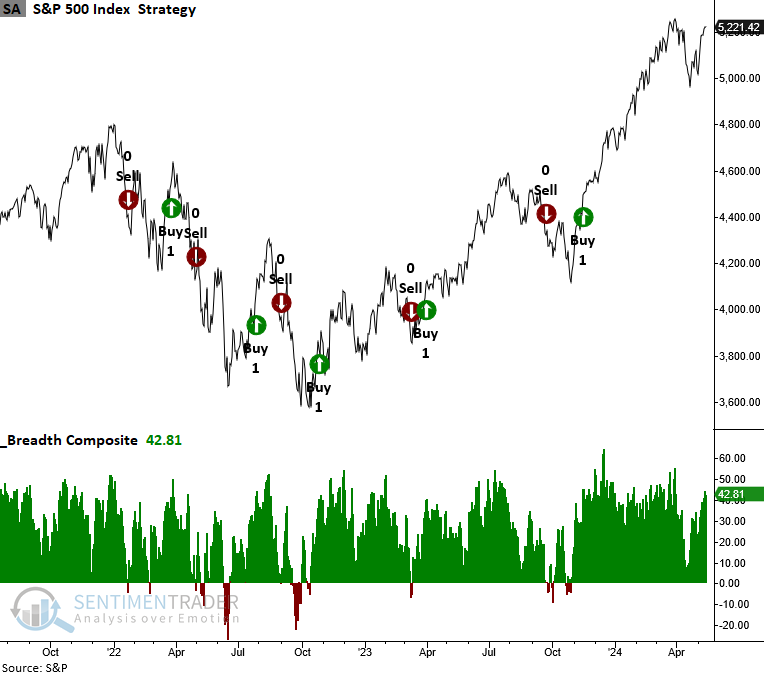
At the end of last week, a breadth composite for the S&P 500 Technology sector increased above 41%, triggering a buy signal for the group.
The previous trading alert occurred in November 2023, leading to an 18.7% gain over the following three months. Using the breadth composite as a strategy that initiates a long position on a cross above 41% and exits on a move below 0%, the strategy signal gained 16.29% from the entry in November 2023 to the exit in April 2024.
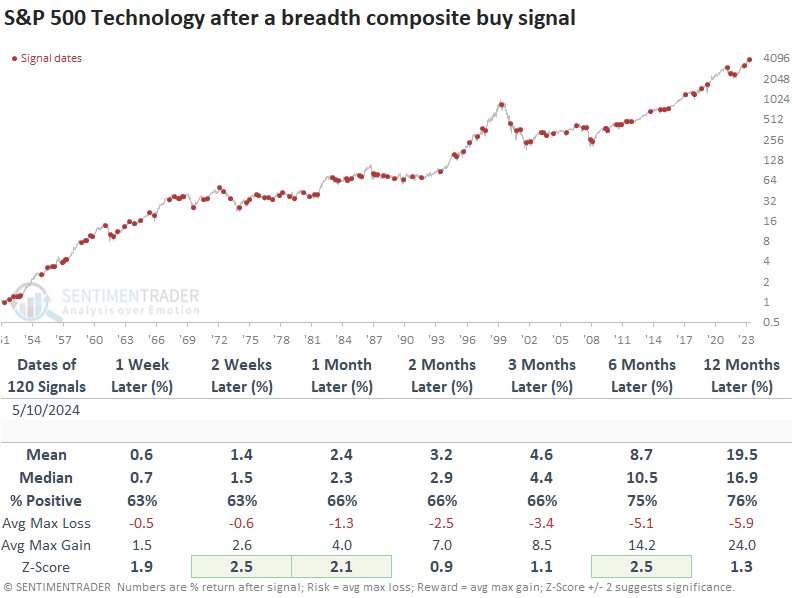
Similar breadth composite signals exhibited positive returns
Following a breadth composite surge that exceeds 41%, the S&P 500 Technology sector displayed an upward bias over the following year, with several horizons showing significance relative to random returns.
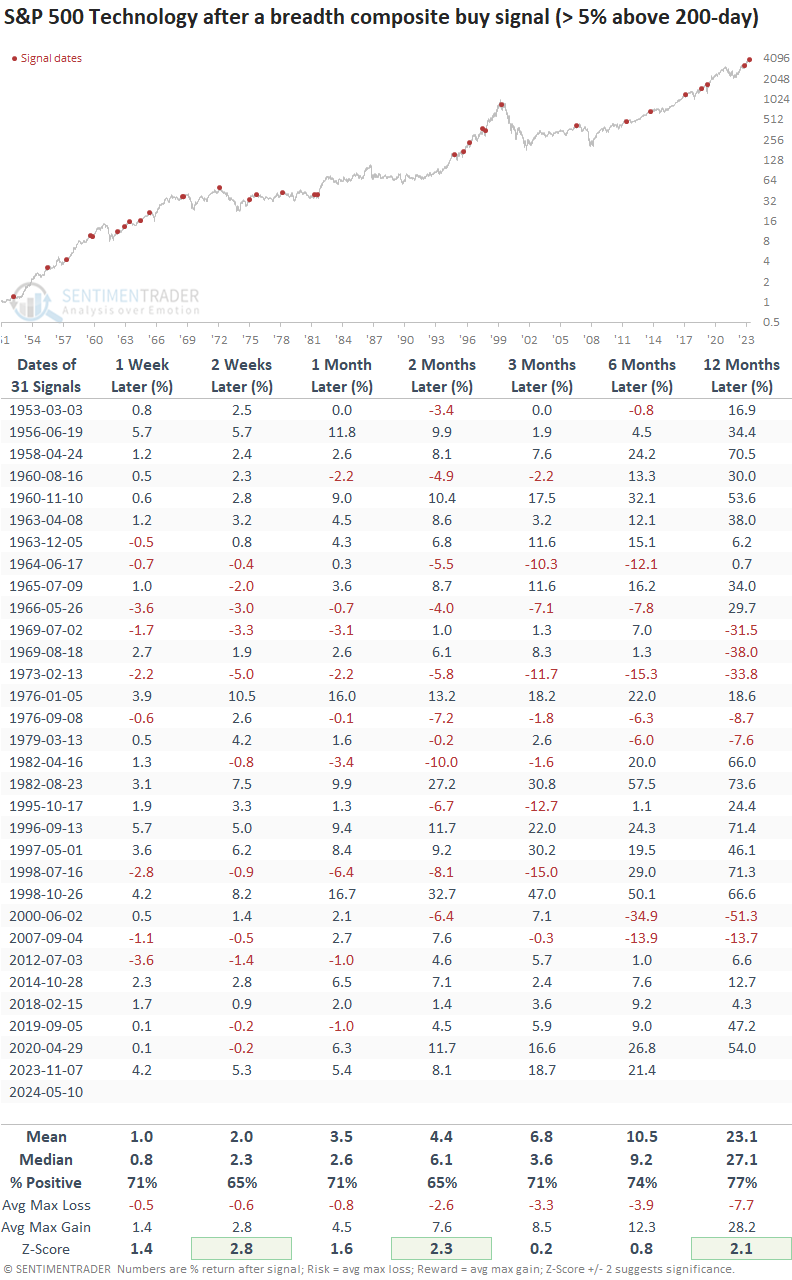
Precedents that occurred with the Technology sector 5% or more above its 200-day average, context similar to now, displayed higher win rates but slightly lower returns compared to signals at any random time, a common trait in uptrends. Once again, several returns showed significance relative to random returns over the study period.
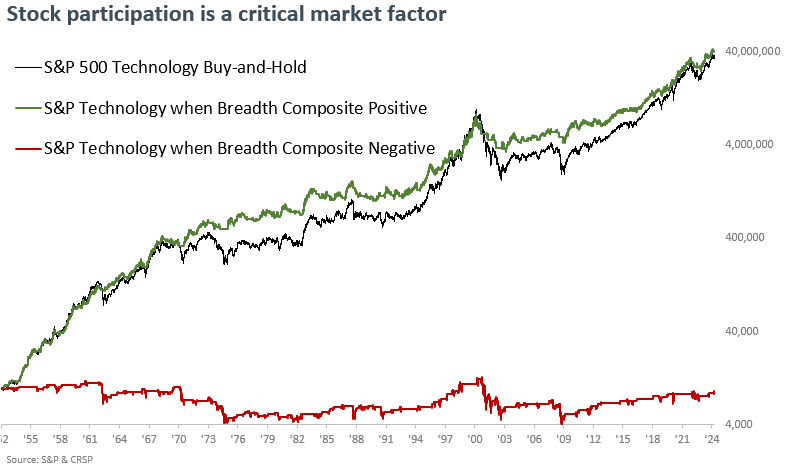
When the breadth composite strategy for the S&P 500 Technology sector maintains a positive trend, a $10,000 initial investment grows to $40,319,735, surpassing the buy-and-hold gain of $36,946,990 and significantly outperforming the periods with negative breadth, which actually result in a slight loss from the initial capital.
The breadth composite strategy could serve as an overlay for a trading system. For instance, the system would refrain from issuing a buy signal for an individual stock unless the strategy's trend was positive, ensuring a sector tailwind.
I monitor breadth composite signals and strategies for several indexes and sectors. Unlike Technology, the S&P 500, Financials, Industrials, and Consumer Discretionary have maintained long positions since alerts were triggered last fall. Additionally, the Nasdaq 100 remains on a sell signal from 2024-04-12.
For reference, this chart of the S&P 500 breadth composite utilizes a 40% threshold for buy signals and 2% for sell signals.
Absolute and relative trend scores
While absolute trend scores are positive, albeit weaker than other sectors, relative trend scores are negative for both the cap and equal-weighted S&P 500 Technology sector ETFs.
In a scenario where both trend and breadth indicators are favorable, but the relative trend is negative, it would be prudent for investors to maintain a market or underweight allocation compared to the benchmark until relative trends improve.
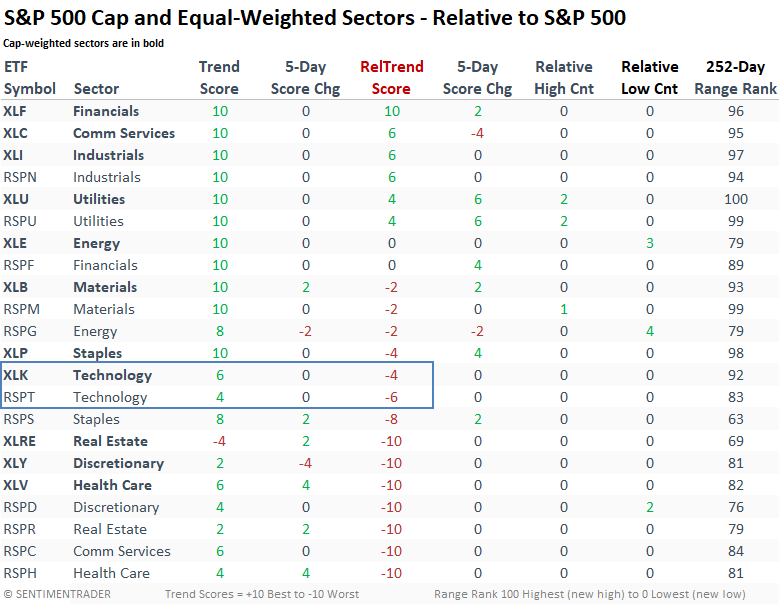
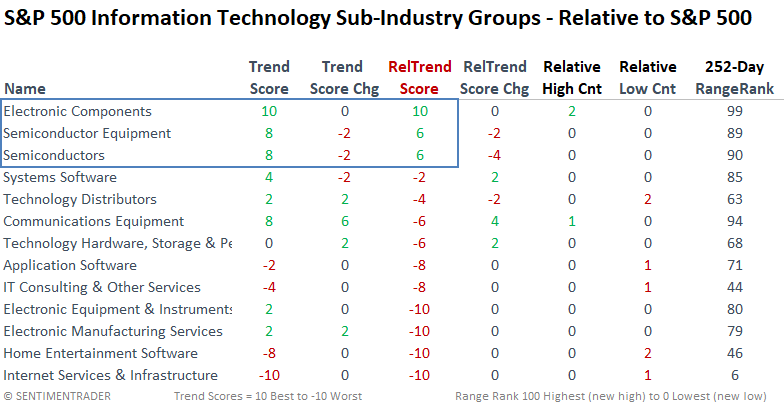
When I examine sub-industry groups for the Technology sector, electronic components, semiconductor equipment, and semiconductors are the only industries with a positive relative trend score compared to the S&P 500.
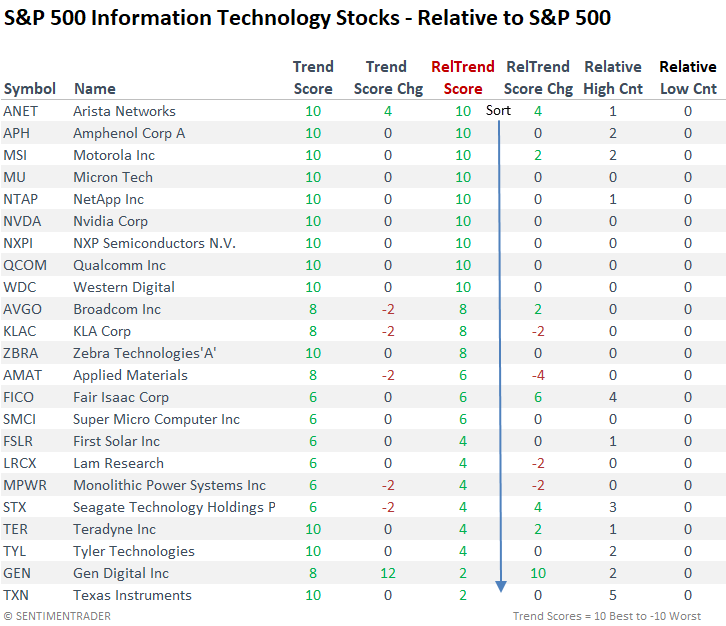
The following table contains all S&P 500 Technology stocks with a positive relative trend score versus the S&P 500. The list is dominated by semiconductor stocks.
What the research tells us...
Market breadth indicators for the S&P 500 Technology sector have improved, triggering a buy signal for the group. Similar breadth-based signals have historically been advantageous as a standalone trading signal or as a strategy. Despite the sector's positive trend and breadth backdrop, its relative trends are negative, advising against overweighting the group. Within Technology, Electronic Component and Semiconductor stocks exhibit the highest relative trend score rankings.