
A breadth composite reversed from an oversold condition

Key points:
- A breadth composite cycled from below -13% to above 18% in 15 or fewer sessions
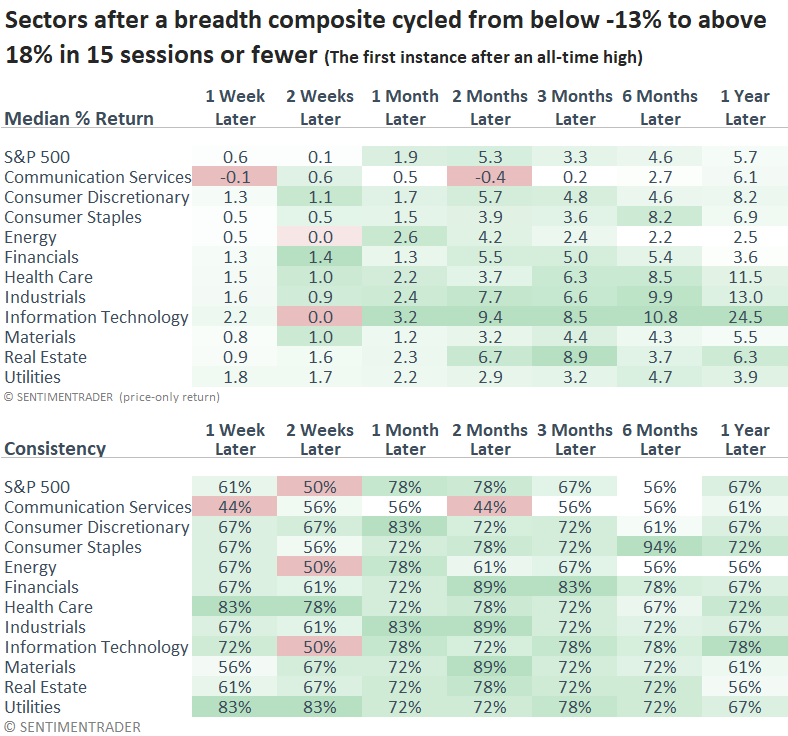
- Comparable recoveries in breadth saw the S&P 500 rally 78% of the time over the next two months
- The technology sector was the best-performing group a year later
- The spread between positive and negative research reports continues to lean bearish
An improvement in participation suggests a multi-month relief rally
Investors face a pivotal choice in a drawdown: they can attempt to buy as stocks plummet, catching the proverbial falling knife, or wait for a confirmed reversal from an oversold condition. Each strategy aligns with different investor risk tolerances, but both approaches demand conviction and discipline.
In a report titled Teetering on the Edge of a Bear Market, I noted that my breadth composite had reached oversold territory, an area often linked to sharp one-day rallies, which indeed followed soon after, with the S&P 500 gaining 9.5% on April 9th. Subsequently, that composite climbed above a critical threshold, triggering a reversal signal. While it doesn't qualify as a thrust, similar recoveries have sometimes signaled the start of a new cyclical upswing. Other times, they've marked temporary relief within a broader bear market.
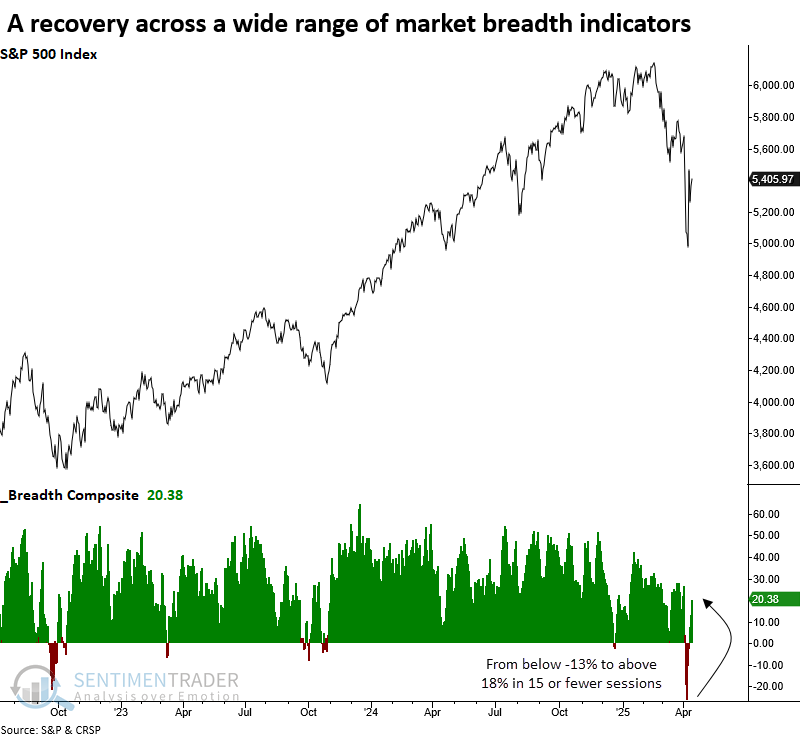
Similar breadth composite reversals suggest a multi-month rally
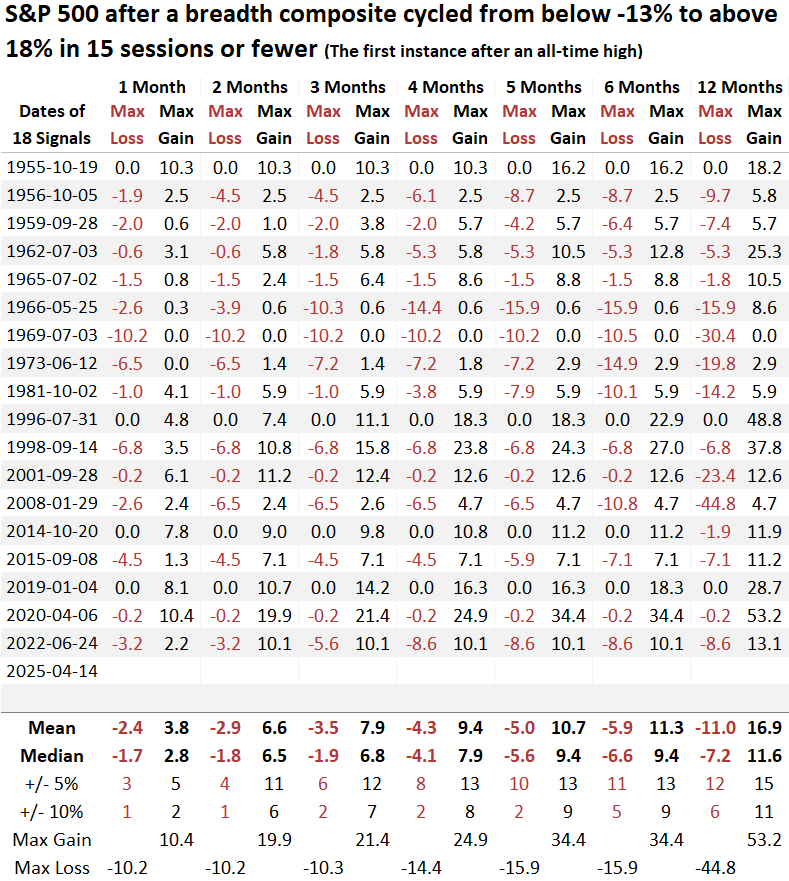
Whenever a breadth composite triggered a reversal signal for the first time after an all-time high, the S&P 500 rose in 78% of the cases over the subsequent two months for a median gain of 5.3%, which exceeded random returns over the study period, suggesting significance. However, returns and consistency diminished between three and six months later, as bear market rally scenarios weighed on performance results.
Signals have been markedly more robust since 1981. I suspect the change in character has to do with the interest cycle. Remember, bond yields were in a secular uptrend until 1981. During the secular uptrend in yields between 1966 and 82, oversold reversals did not produce favorable bear market rallies. In contrast, signals afterward, like those in 2001, 2008, and 2022, posted gains within the first three months.
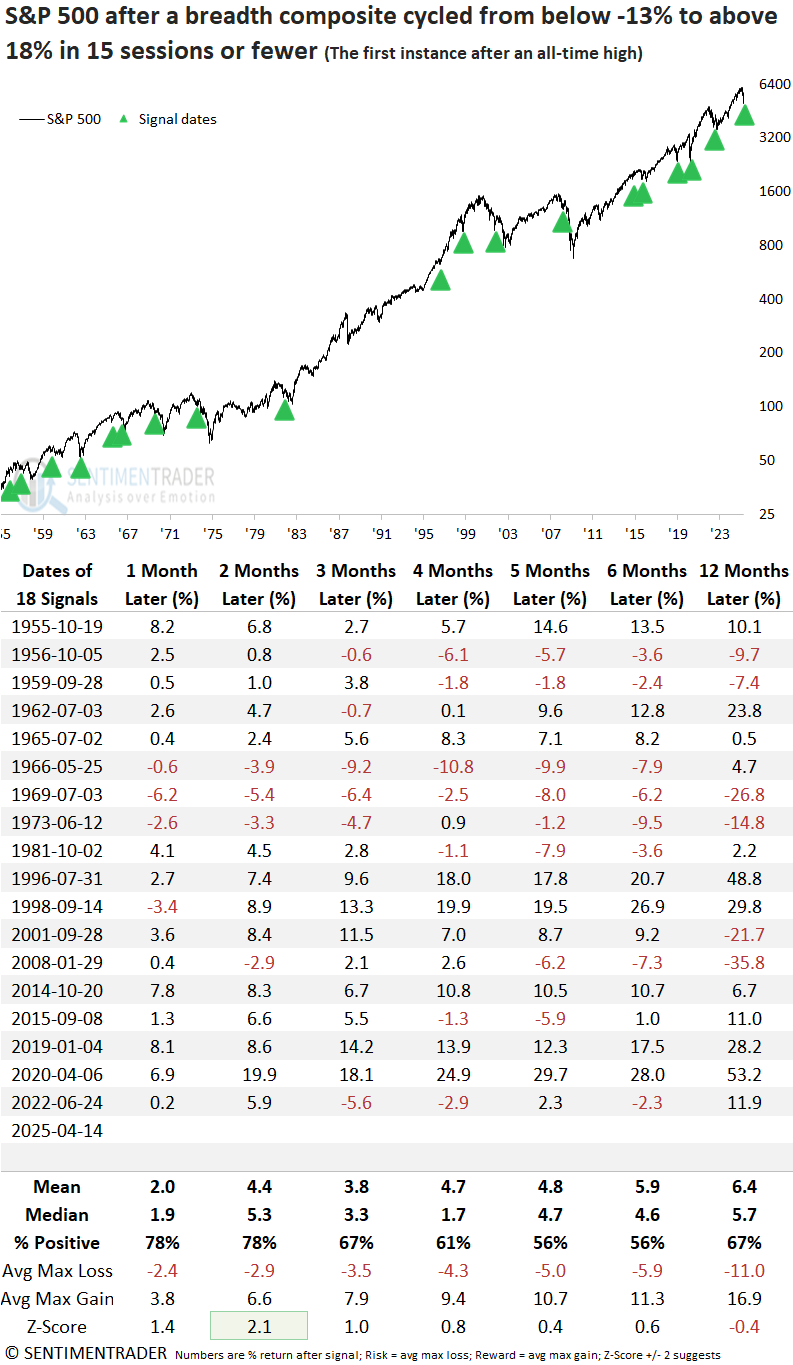
During the favorable two-month window, the S&P 500 rallied 5% or more on 11 occasions, compared to just 4 instances of 5 %+ declines, indicating a favorable risk/reward setup.
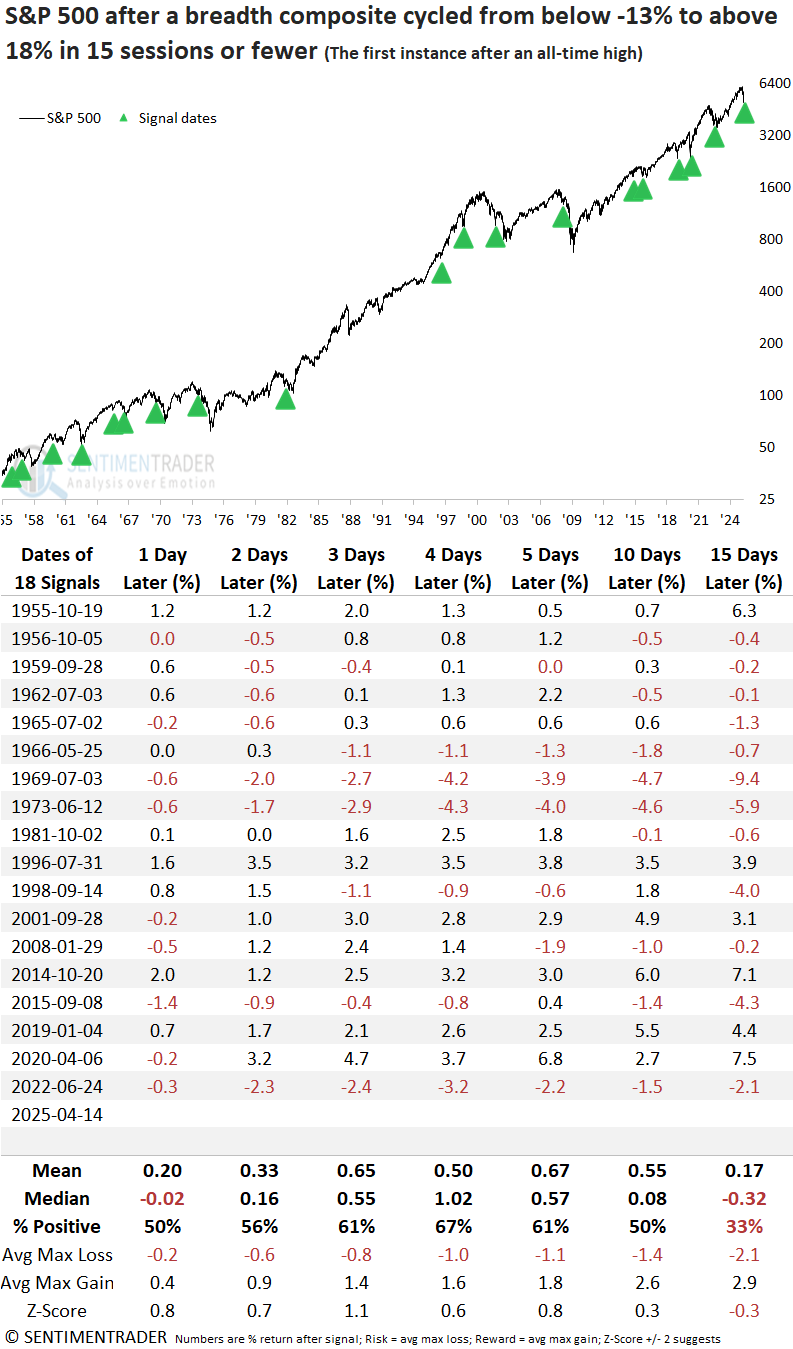
The ultra short-term performance table suggests that if any backing and filling occurs, it's most likely to happen around the three-week mark.
Following an oversold condition, the technology sector tends to lead the rebound, outperforming all other groups over the subsequent one-, two-, six-, and twelve-month periods.
Where the indicators stand
Over the past two months, the number of negative research reports I've published has outnumbered the number of positive ones, suggesting that the weight of the evidence leans bearish.
Bearish reports began increasing late last year, surpassing bullish ones for the first time on January 13th, and reached a new cycle high just before the Liberation Day meltdown, signaling a clear warning of heightened risk for equities.
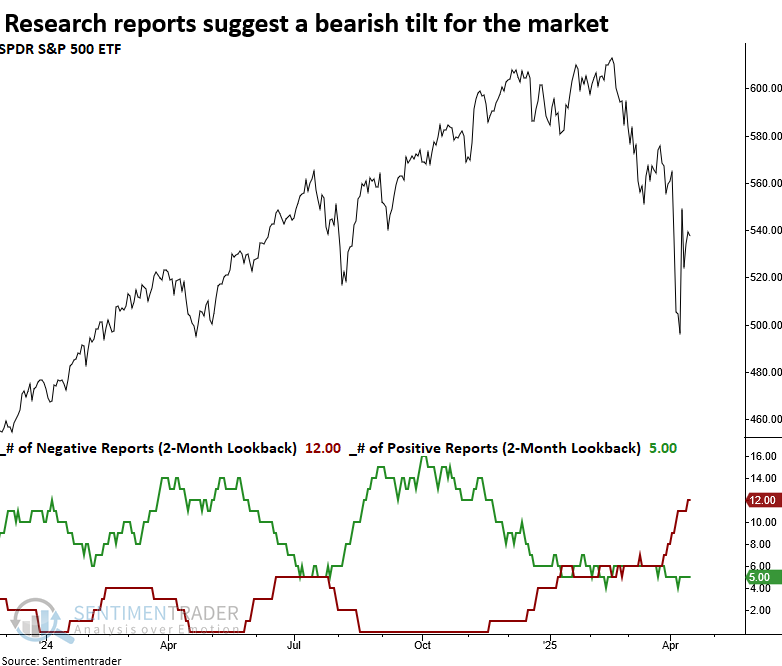
These rolling cumulative indicators compare the returns and consistency for a signal to the study period results over one- to six-month horizons to determine if a report is bullish or bearish. For example, today's signal showed 8 out of 12 metrics as positive compared to the study period, placing this report in the bullish category. The indicators are exclusively based on S&P 500 signals.
What the research tells us...
A breadth composite for the S&P 500 recently plunged to a deeply oversold level before reversing, triggering a tactical buy signal. Historically, similar setups have seen the index rally 78% of the time over the following two months, highlighting the potential for a multi-month rebound. However, looking beyond that window, the strength and consistency of returns tend to diminish between the three- to six-month mark, as many of these precedents were bear market bounces that ultimately resumed their downward path. While this reversal is a constructive development and lends credence to the case for a multi-month rally, the broader weight of the evidence remains tilted toward a bearish outlook. Consequently, I would only add exposure for a potential relief rally should stock indexes approach the previous lows.