Data &
Technology
Research
Reports
Report Solutions
Reports Library
Actionable
Strategies
Free
Resources
Simple Backtest Calculator
Simple Seasonality Calculator
The Kelly Criterion Calculator
Sentiment Geo Map
Public Research Reports
Free Webinar
Pricing
Company
About
Meet Our Team
In the News
Testimonials
Client Success Stories
Contact
Log inLoginSign up
< BACK TO ALL REPORTS

A Big Turnaround in Financials' Medium Term Trends

Jason Goepfert
2021-08-31
Within only a few weeks of fewer than 20% of financial stocks holding above their 50-day moving averages, already more than 95% have regained their averages. That's a quick turnaround and similar thrusts tended to precede more gains for the sector.

Financial stocks have had a big thrust in recent weeks. Dean has highlighted this several times in the premium notes (here and here).

After lagging the broader market and reaching modest oversold levels in June and July, the estimable Liz Ann Sonders noted that the percentage of Financial stocks trading above their 50-day moving averages has gone from a low level to a very high one.

Within 30 days, the sector cycled from having fewer than 20% of its members above their medium-term averages to having more than 95% of them above. 

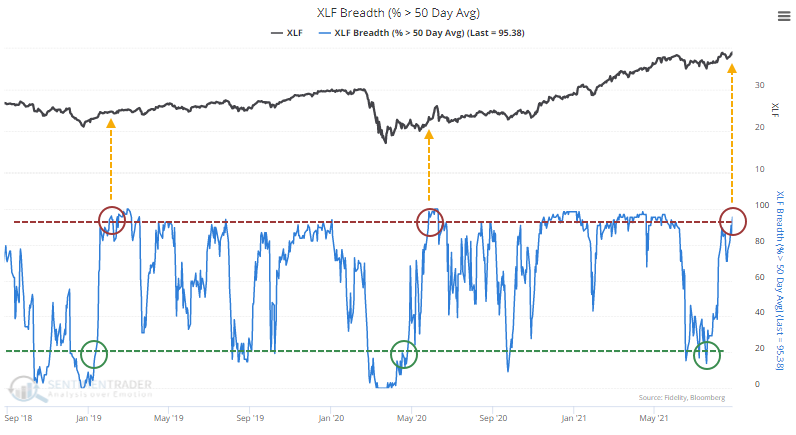
In the past five years, the only times this has triggered were February 2019 and May 2020, both leading to double-digit gains.

A GOOD SIGN OF A QUICK SHIFT IN SENTIMENT

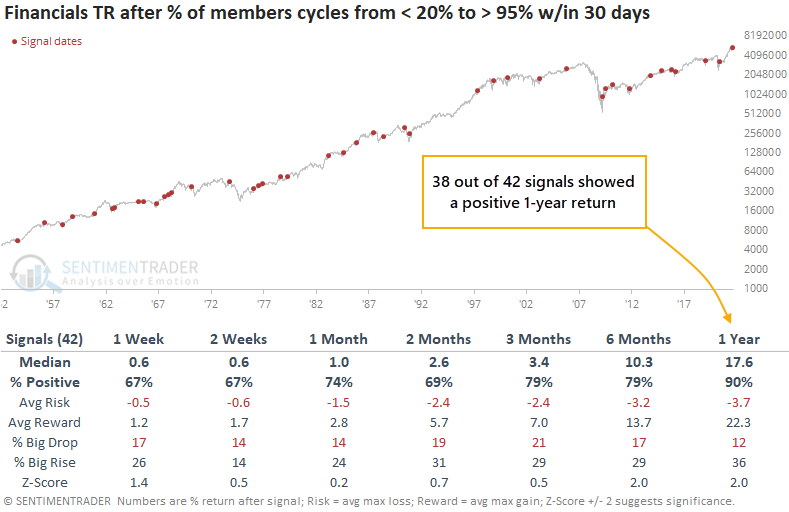
Whenever medium-term participation in Financials cycles from a low to a very high level in a relatively short number of days, the sector has tended to keep going. There have been 42 such signals over the past 70 years, and 38 of them led to a positive one-year total return (with one of the losses being a minuscule -0.3%).

Context is important, so the table below narrows down the signals to only include times when Financials were not in a correction at the time. 

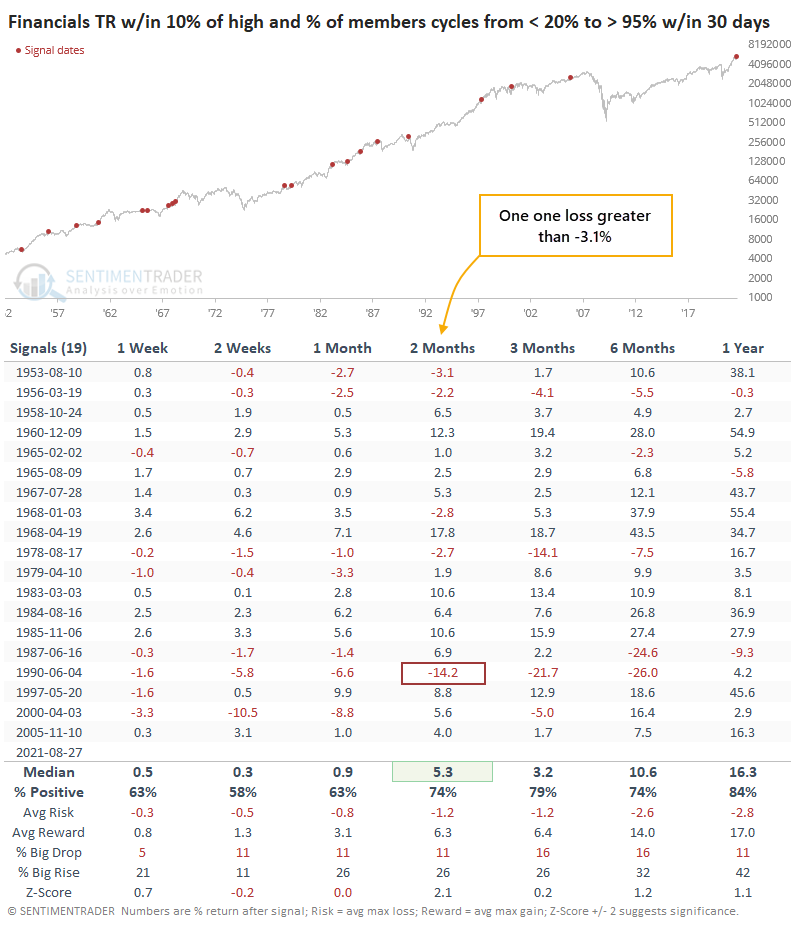
Again, returns going forward were good, with the most impressive returns being over the next two months. Reward was more than 5 times risk, and only one signal showed a loss greater than -3.1% (granted, that was a large loss).

WATCH THE DOWNSIDE

The more we restrict the conditions, the smaller the sample size, but at the same time, get closer to conditions like we have now. So, if we look only at signals that triggered when Financials were sitting at a new high at the time, there was only one (temporarily) large loss.

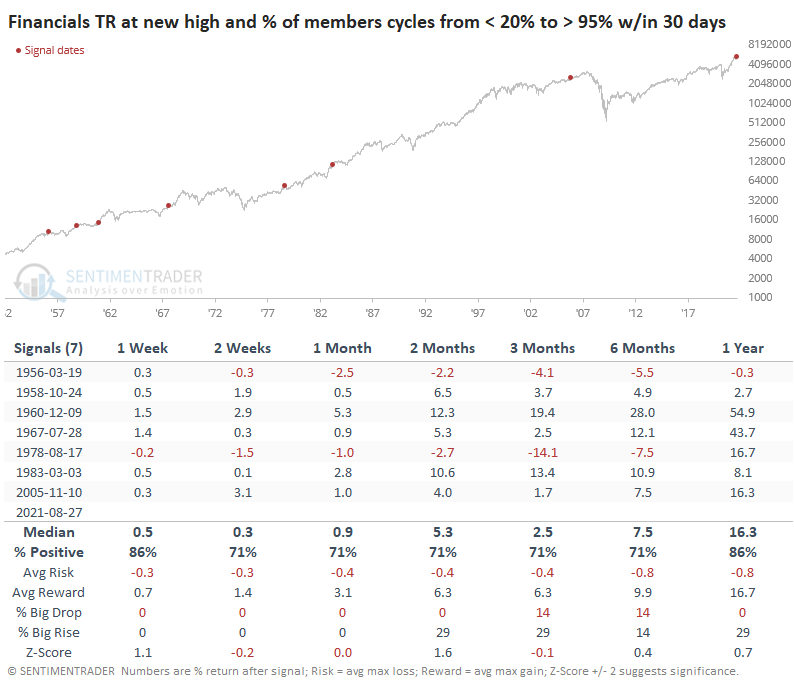
Again, the most impressive aspect was the risk/reward ratio, which we can see in more detail in the chart below. 

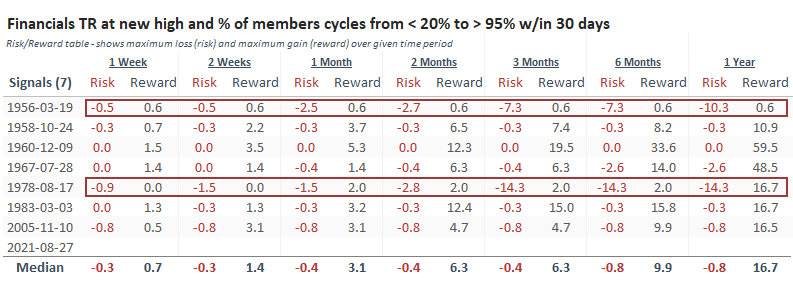
It's interesting to note that the two losing signals started losing almost immediately, with very little upside. The five winning signals started winning almost right away, with minimal downside. It's tough to read that much into such a tiny sample size, but it would suggest that if Financials can keep buyers' interest in the week(s) ahead, then it bodes well for the longer term as well.

Sorry, you don't have access to this report

Upgrade your subscription plan to get access
Go to Dasboard
DATA &
TECHnologies
IndicatorEdge
‍
BackTestEdge
‍
Other Tools
‍
DataEdge API
RESEARCH
reports
Research Solution
‍
Reports Library
‍
actionable
Strategies
Trading Strategies
‍
Smart Stock Scanner
‍
FREE
RESOUrCES
Simple Backtest
Calculator
Simple Seasonality
Calculator
The Kelly Criterion
Calculator
Sentiment Geo Map
‍
Public Research Reports
‍
Free Webinar
COMPANY
‍
About
‍
Meet our Team
‍
In the News
‍
Testimonials
‍
Client Success Stories
Pricing
Bundle pricing
‍
Announcements
‍
FAQ
© 2024 Sundial Capital Research Inc. All rights reserved.
Setsail Marketing
TermsPrivacyAffiliate Program
Risk Disclosure: Futures and forex trading contains substantial risk and is not for every investor. An investor could potentially lose all or more than the initial investment. Risk capital is money that can be lost without jeopardizing ones’ financial security or life style. Only risk capital should be used for trading and only those with sufficient risk capital should consider trading. Past performance is not necessarily indicative of future results.

Hypothetical Performance Disclosure: Hypothetical performance results have many inherent limitations, some of which are described below. No representation is being made that any account will or is likely to achieve profits or losses similar to those shown; in fact, there are frequently sharp differences between hypothetical performance results and the actual results subsequently achieved by any particular trading program. One of the limitations of hypothetical performance results is that they are generally prepared with the benefit of hindsight. In addition, hypothetical trading does not involve financial risk, and no hypothetical trading record can completely account for the impact of financial risk of actual trading. for example, the ability to withstand losses or to adhere to a particular trading program in spite of trading losses are material points which can also adversely affect actual trading results. There are numerous other factors related to the markets in general or to the implementation of any specific trading program which cannot be fully accounted for in the preparation of hypothetical performance results and all which can adversely affect trading results.

Testimonial Disclosure: Testimonials appearing on this website may not be representative of other clients or customers and is not a guarantee of future performance or success.