
A bevy of seasonal opportunities - and a ton of uncertainty

Key points
- Seasonality tells you how a given security has acted in the past during a certain time period
- A significant number of securities are soon to be entering one of the most favorable seasonal times of the year
- To key to taking advantage is in looking for price to confirm seasonal expectations
How to approach seasonality
My rule of thumb is simple: a) seasonality tells you where to look, and b) price tells you what to do. If a security is moving in the "expected" direction during a seasonally favorable (or unfavorable) period (i.e., if it is actually doing what it should be doing), that represents a potential trading opportunity.
Regarding price action, there are two possibilities to look for. Ideally, the security in question will already be moving in the "correct" direction as a seasonally favorable (or unfavorable) period begins. This can offer an opportunity to "ride the trend", which is the most direct way to profit in the markers.
The other possibility is a major reversal prior to or during the seasonal period. In other words, if a security is falling hard as a new seasonally favorable period begins and then reverses sharply to the upside, this too can offer a potential opportunity.
Where we are now
The potential good news is that an abnormally large number of securities will soon be entering one of the most seasonally favorable times of the year. The bad news is that most of them are presently in a price downtrend. As alluded to above, the objective of seasonality is not to pick tops and bottoms with uncanny accuracy. The objective is simply to alert us to potential opportunities. If the price is presently in a sharp decline it suggests that we should wait for an upside reversal before jumping in.
The recent turmoil in the banking sector and the concern associated with such things as bank liquidation have created uncertainty. The stock market hates uncertainty. As a result, the last weekend was filled with roughly 99% of discussions and news coverage skewed to the negative side.
Should a trader ignore the news and blindly pile into specific securities as their seasonally favorable periods begin? Or should they forego seasonal opportunities in the face of bad news? The correct answer may be "both." While acting in the face of plunging price action is typically a dangerous action, so is sticking one's head in the sand. If the market (and the securities highlighted below) do continue to trend lower based on the uncertainty in the market, standing aside may be the best course of action. However, seasonality reminds us to remain alert to the significant upside potential IF the worst fears blow over and a significant reversal unfolds.
The securities to watch
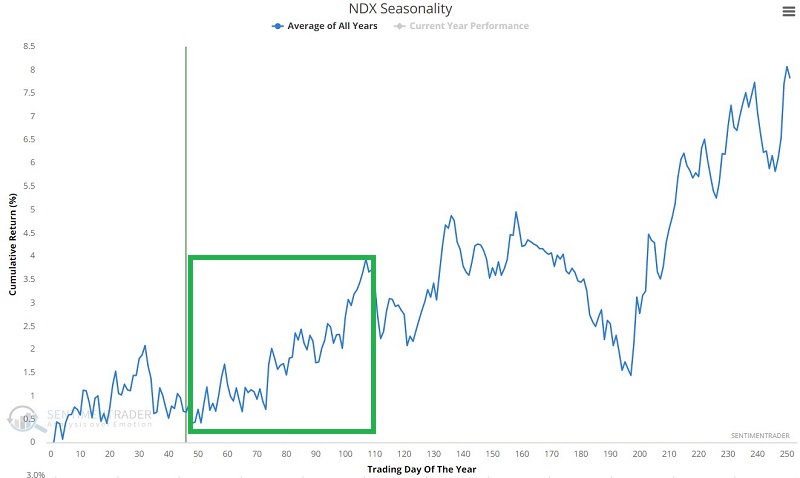
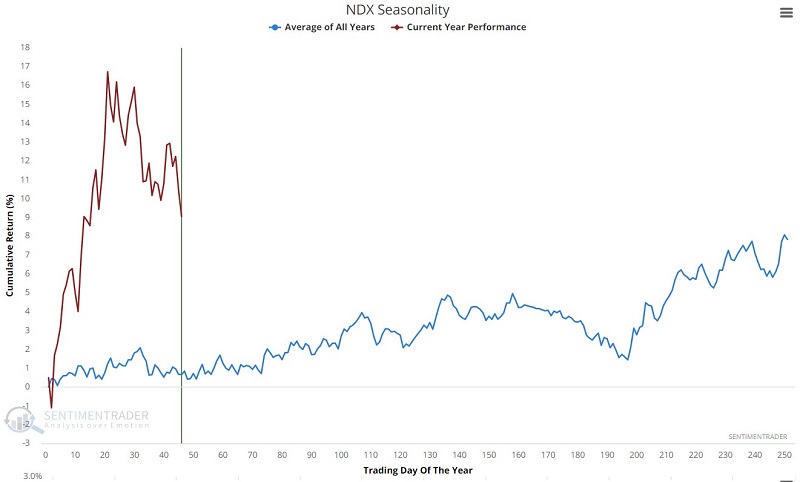
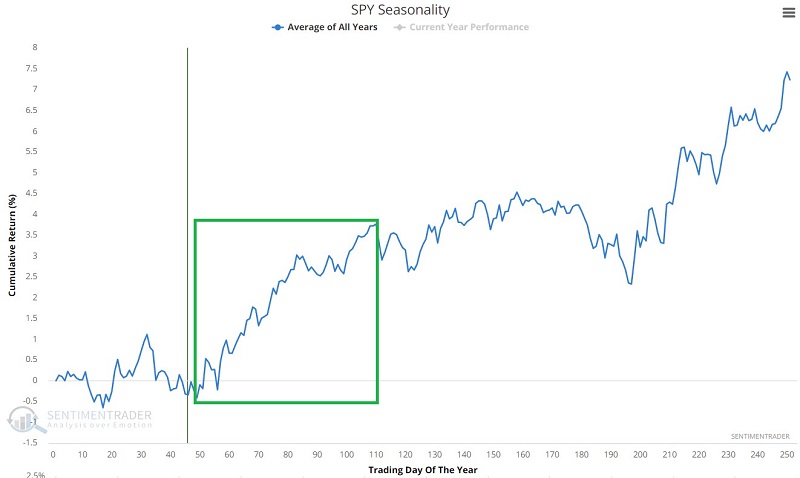
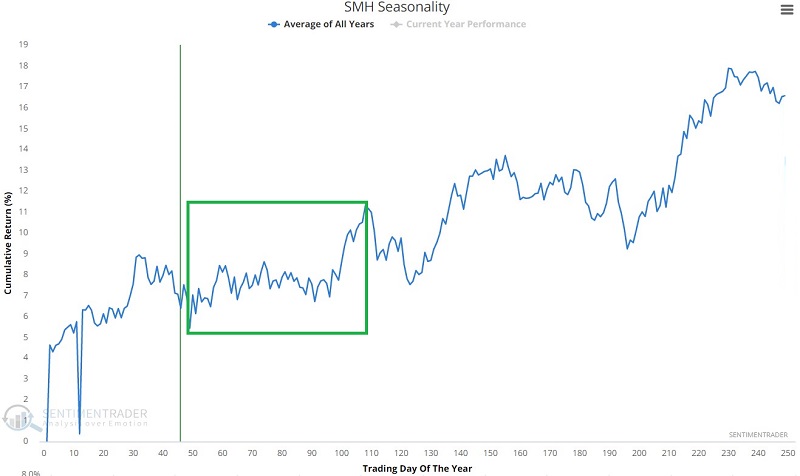
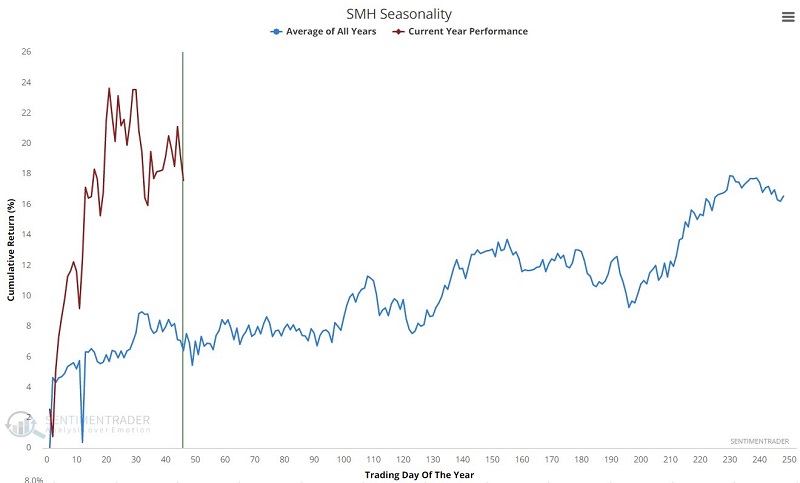
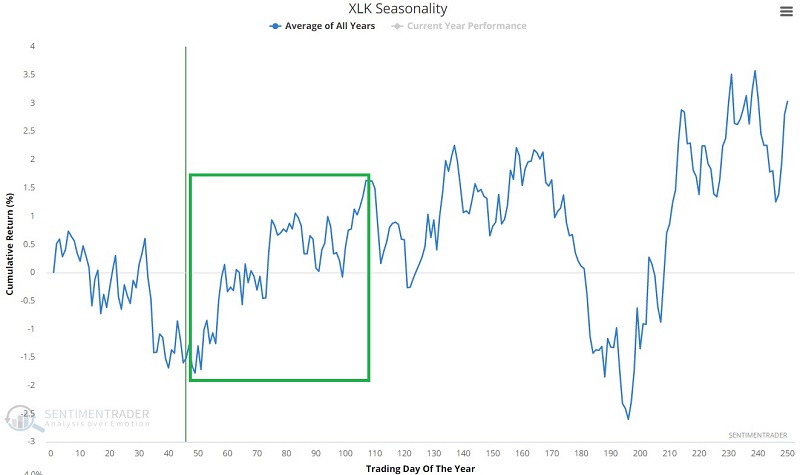
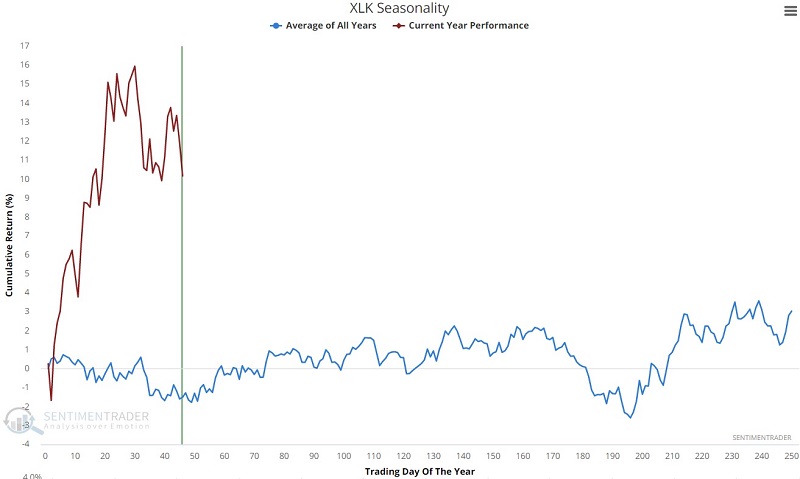
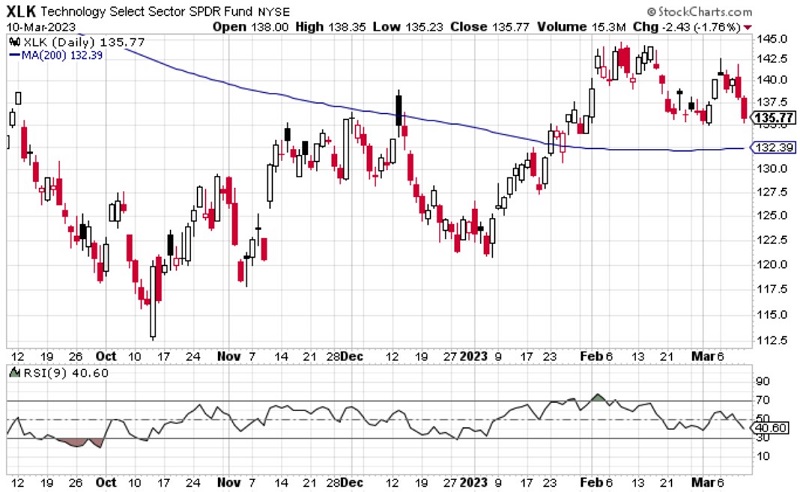
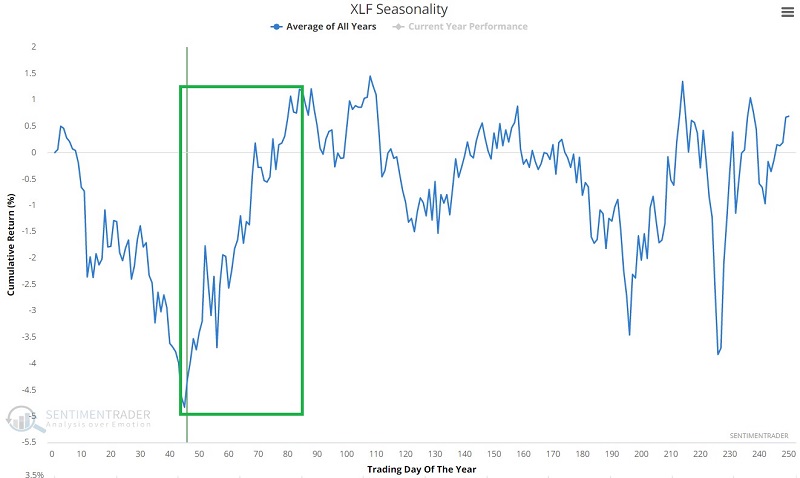
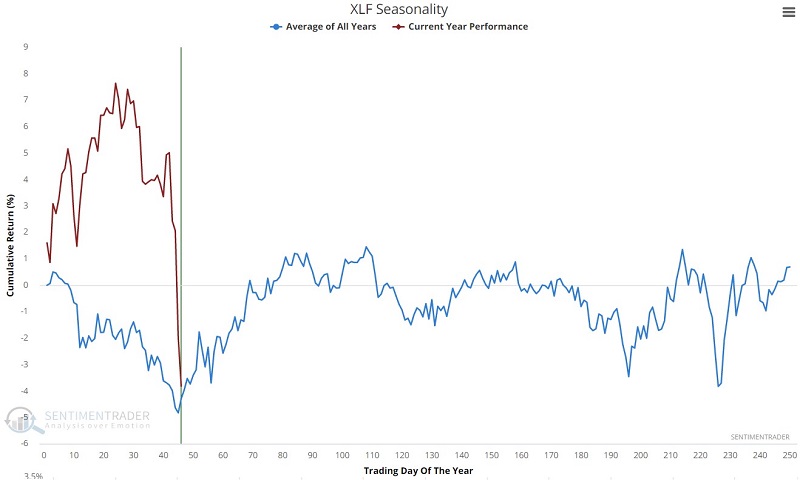
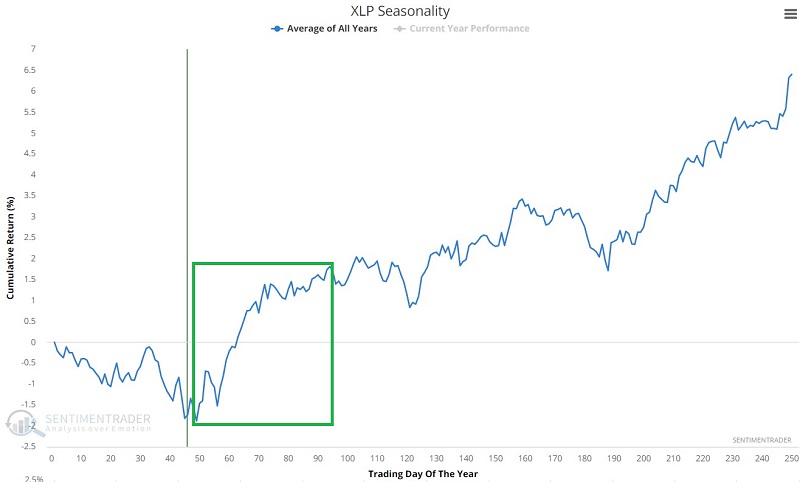
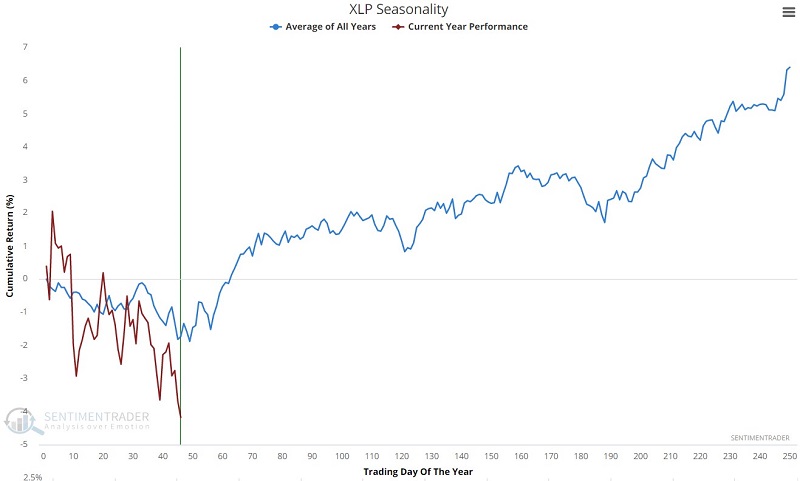
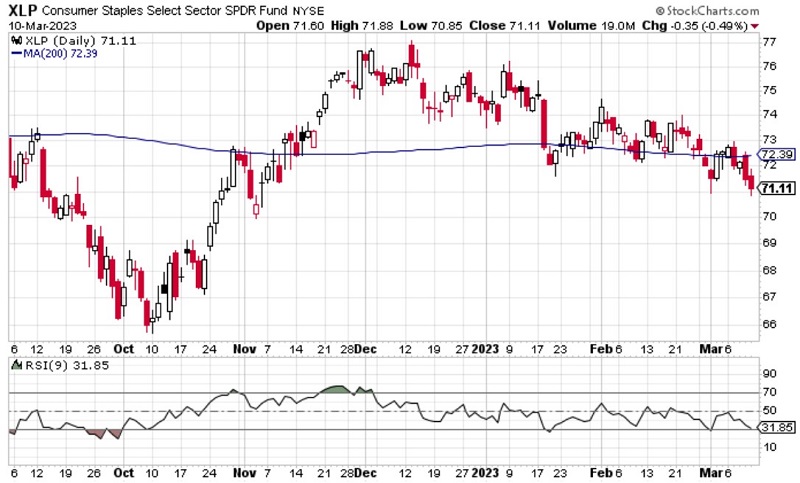
For each security highlighted below, we show three charts:
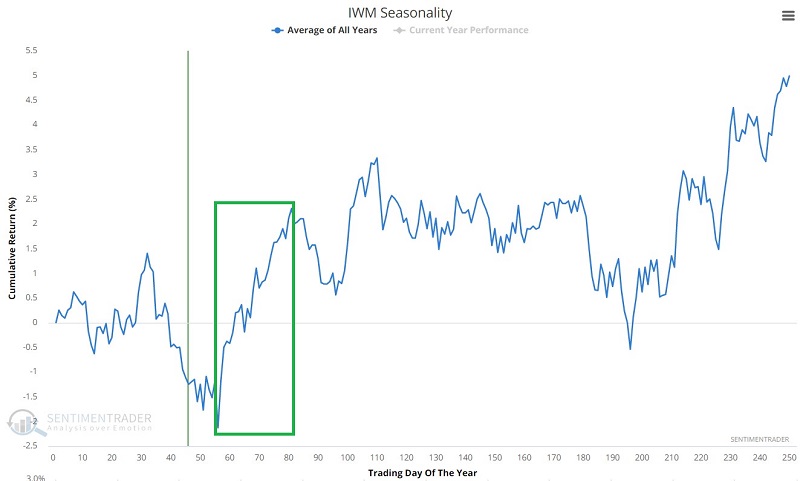
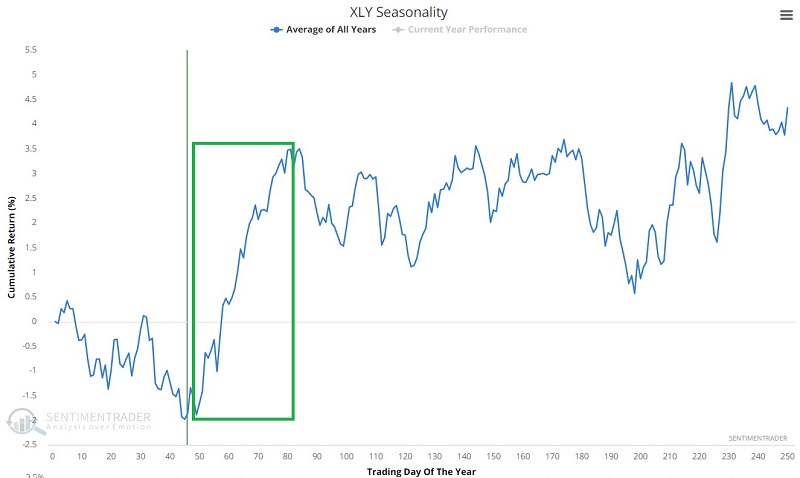
- The annual seasonal trend with the relevant seasonal period highlighted
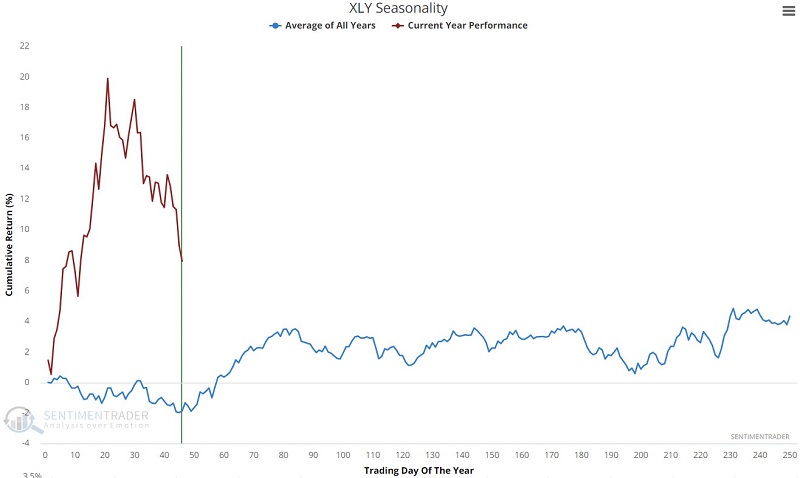
- The annual seasonal trend with 2023 performance to date highlighted
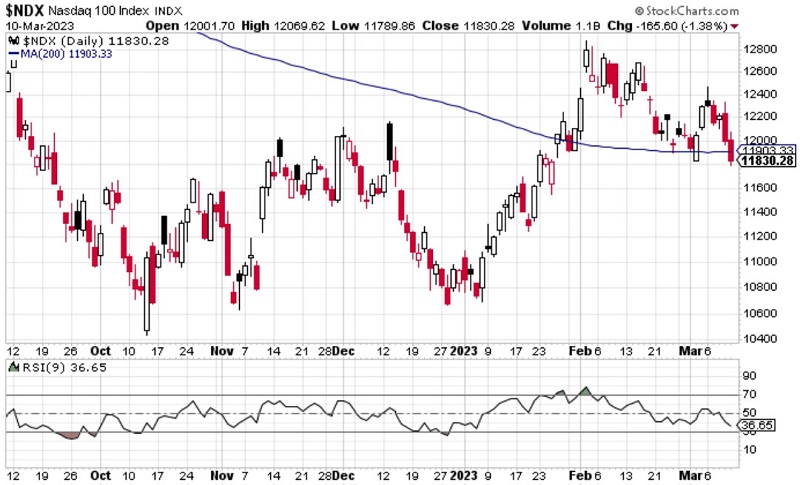
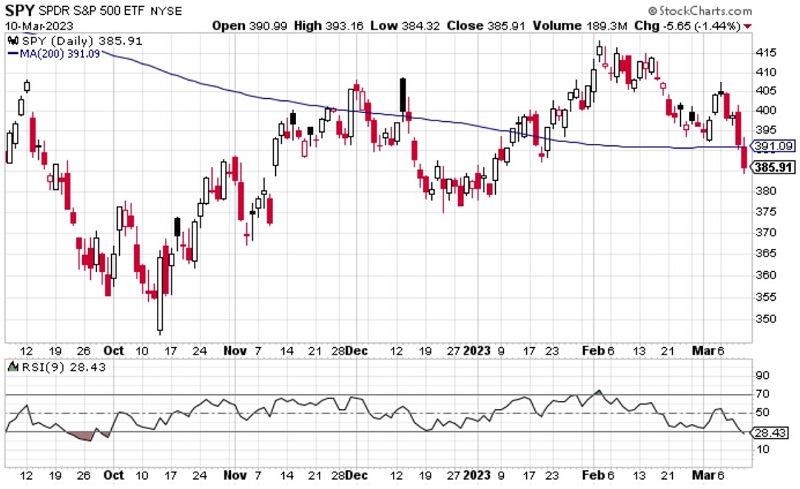
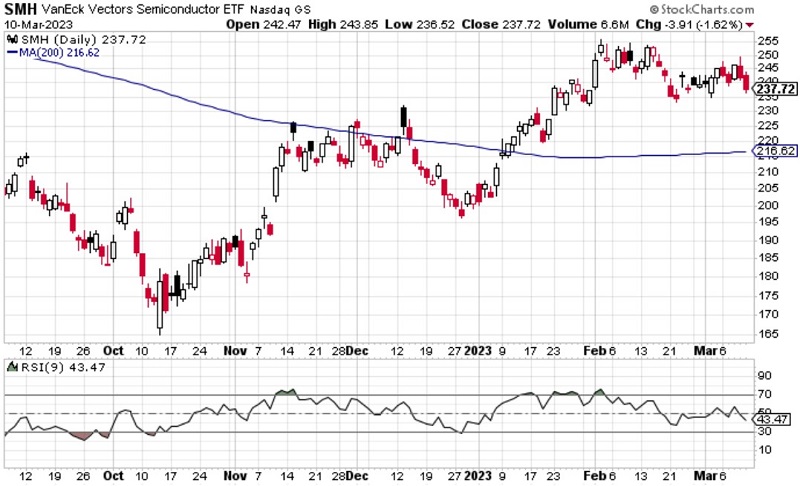
- A bar chart of the price action (courtesy of StockCharts.com)
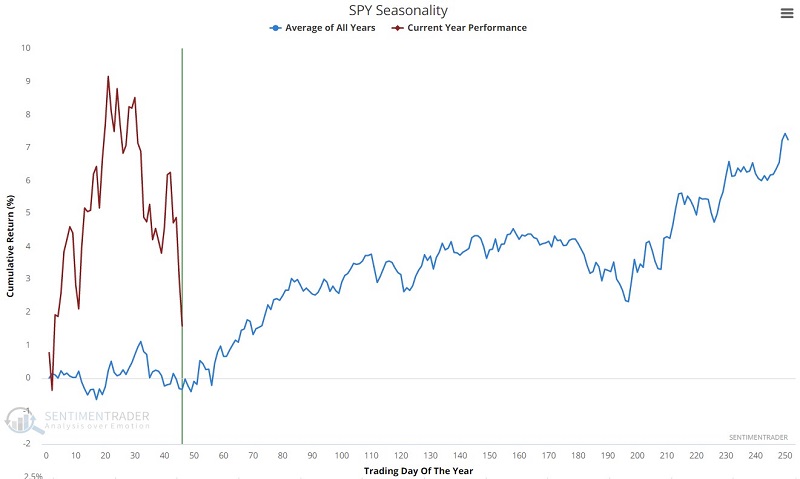
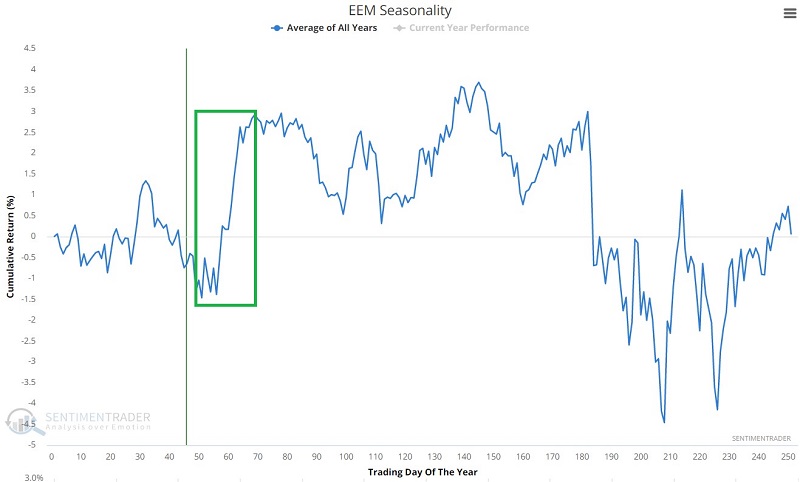
The first chart shows us what "should" happen.
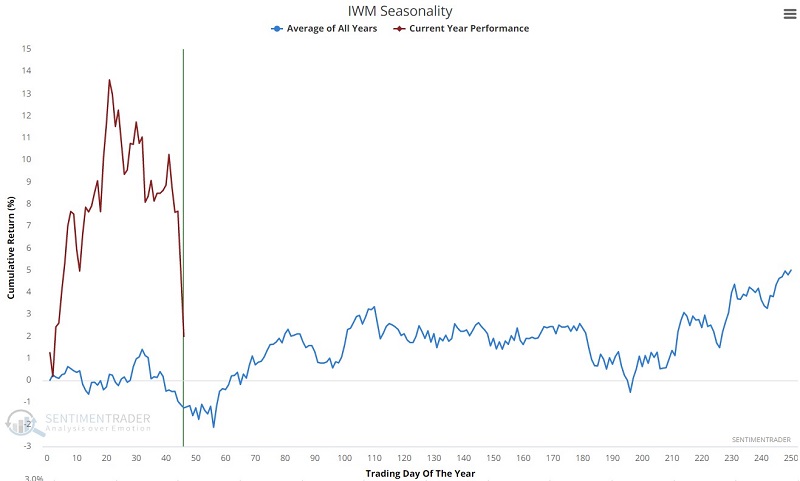
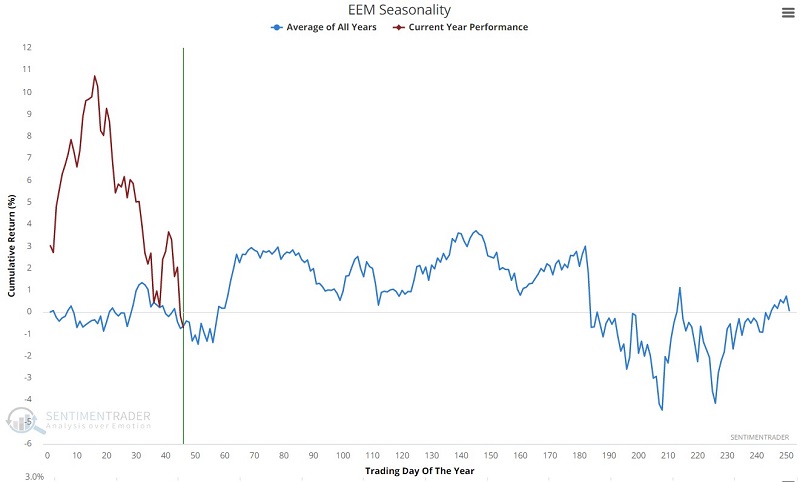
The second chart shows us what has happened so far this year relative to the annual seasonal trend.
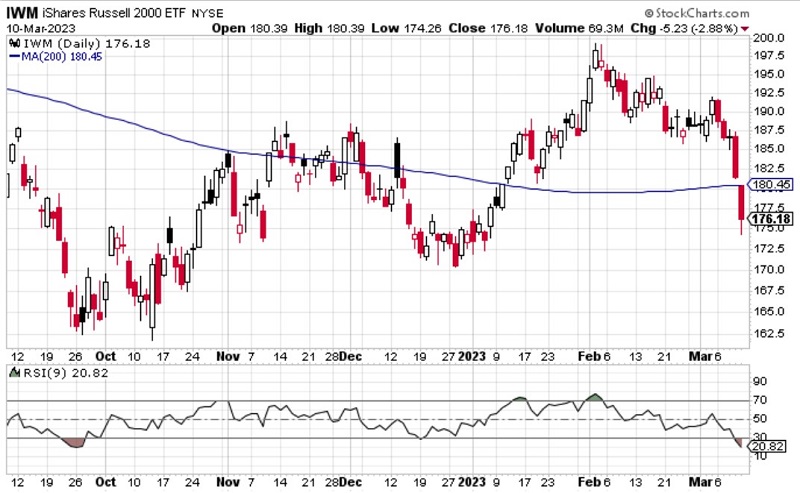
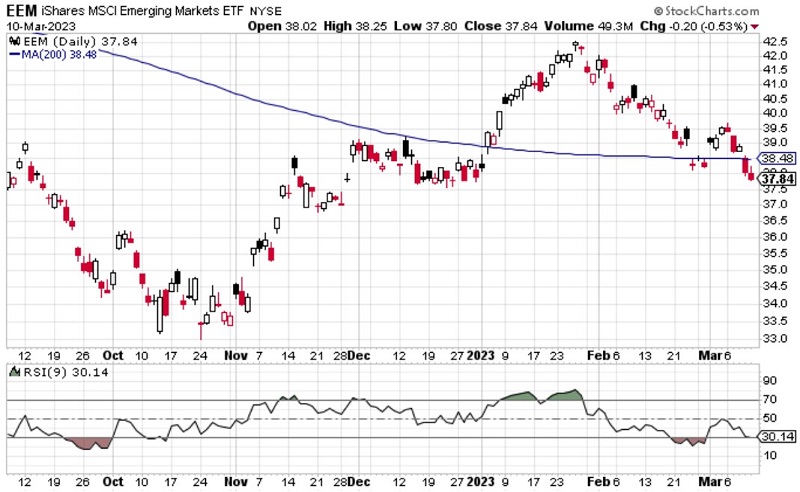
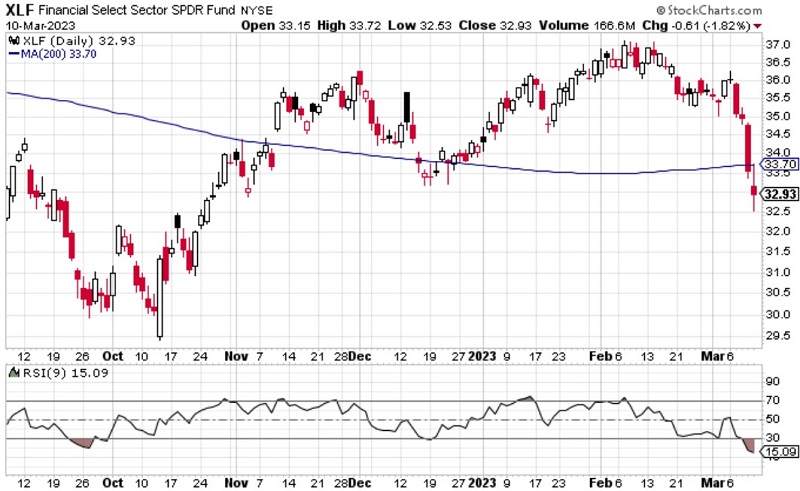
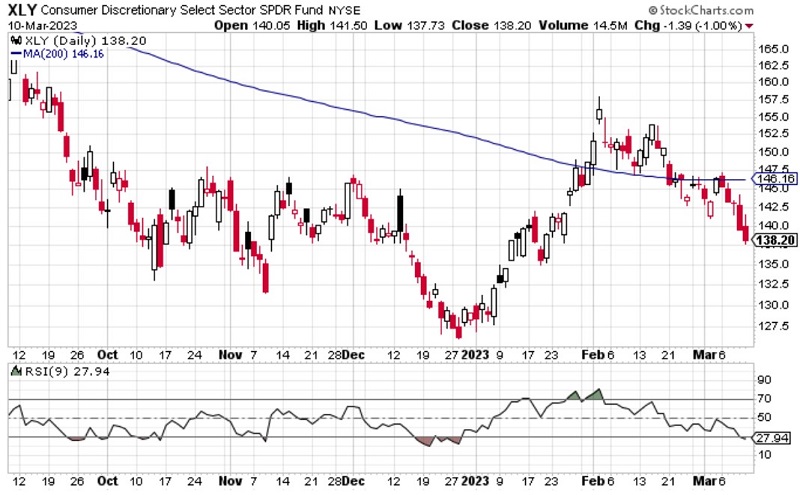
The third chart highlights price action only - note that in many cases, the price has just recently plunged back below the 200-day moving average. This suggests that traders wait for some sign of an upside reversal before considering jumping in.
Nasdaq 100 Index (which can be traded via ticker QQQ)
S&P 500 Index (which can be traded via ticker SPY)
Russell 2000 Index (which can be traded via ticker IWM)
Emerging markets (which can be traded via ticker EEM)
Semiconductors (which can be traded via ticker SMH)
Technology sector (which can be traded via ticker XLK)
Financial sector (which can be traded via ticker XLF)
Consumer Discretionary sector (which can be traded via ticker XLY)
Consumer Staples sector (which can be traded via ticker XLP)
What the research tells us…
The key to using seasonality as a trading tool is to not rely upon it blindly but rather to use it like any other indicator - as a tool to help you identify potential opportunities. The securities and sectors above should be watched closely in the days and weeks ahead, as each has a long history of typically advancing during the late winter into early-to-mid-spring periods. As always, however, there is no guarantee that this year will follow the historically favorable trend. As a result, it is up to each trader to decide when - and if - to actually take the plunge.
If recent events turn into full-blow contagion - with multiple banks going under in domino fashion - then seasonality should likely not be relied upon to "save the day." On the other hand, if the worst fears are not realized, traders should pay close attention for significant opportunities.