
A bevy of big gains trigger notable breadth signals

Key points:
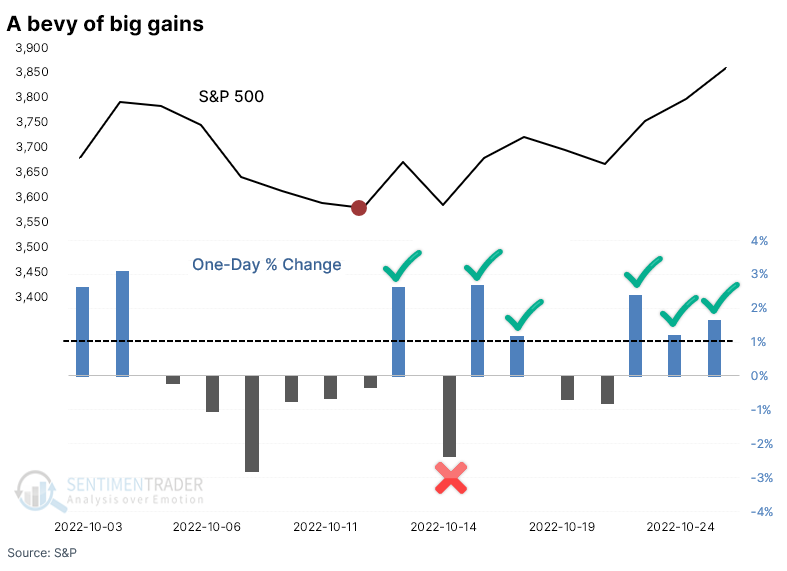
- Since the mid-October low, the S&P 500 has rallied more than 1% six times
- Internal buying interest has turned its long-term McClellan Summation Index
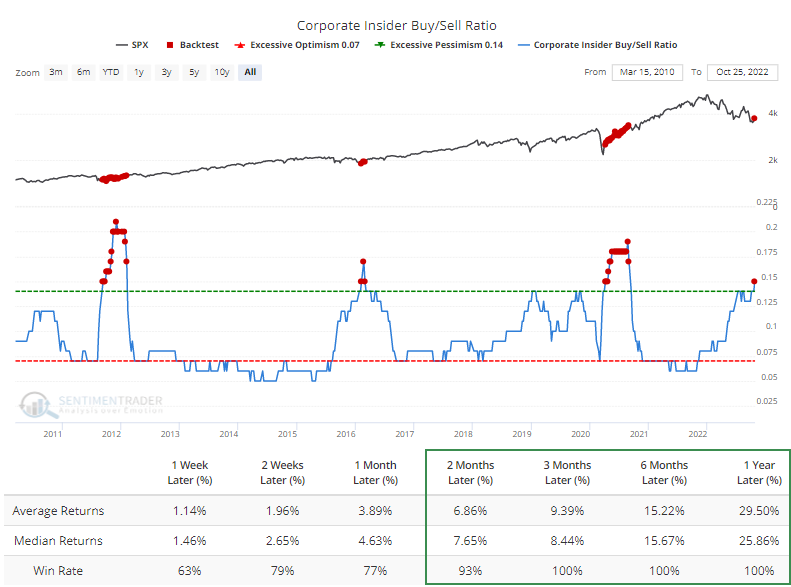
- Corporate insiders have never been less interested in selling
- All of these factors have tended to lead to more of a recovery in the S&P 500
After stocks fell to new lows, buyers have been aggressive
Another day, another big gain for the most benchmarked equity index in the world. The S&P 500 on Tuesday enjoyed its 6th daily gain of 1% or more since the bottom on October 12. It suffered only a single day with more than a 1% loss during these two weeks.
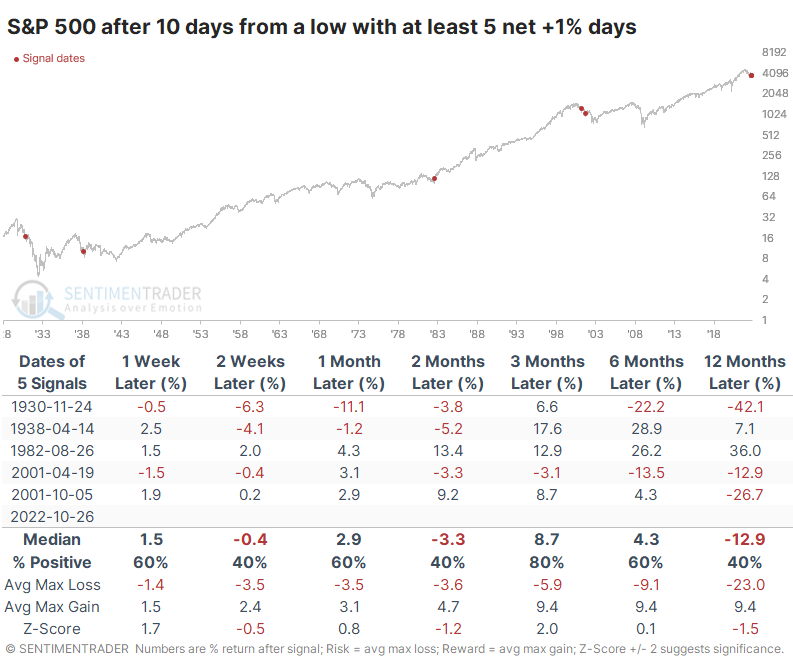
This is the kind of thing that technicians live for, but the evidence on whether it's a reliable sign of bottoming action is mixed. It happened at the generational low in 1982, but otherwise, not so much. It's a little encouraging that four of the five precedents preceded gains over the next few months.
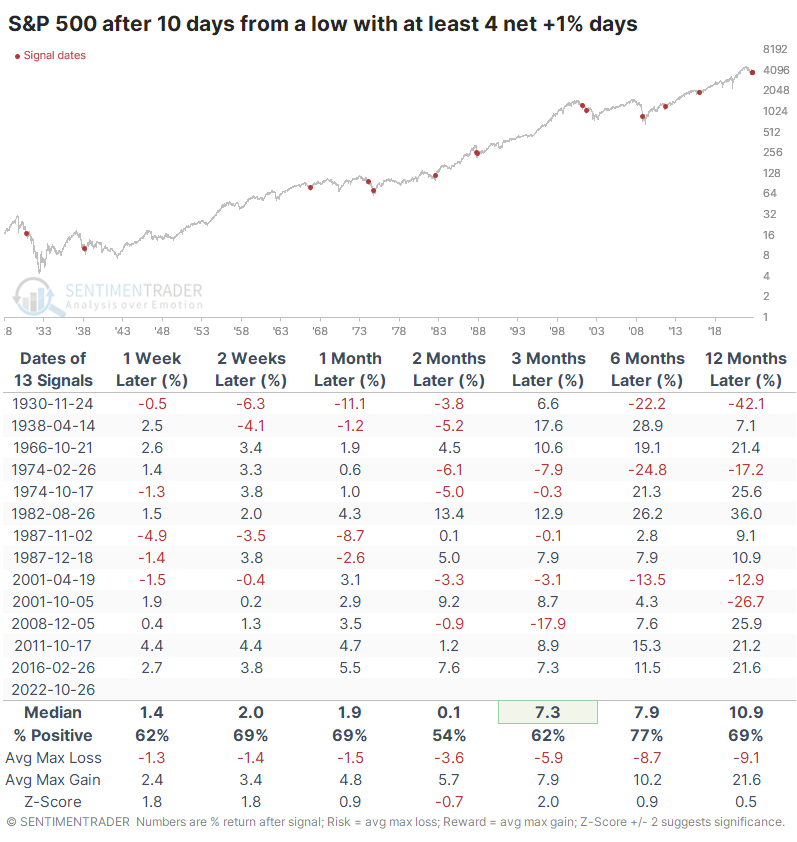
If we relax the parameters to four net +1% days in the two weeks following a 52-week low, the sample size almost triples. It was a modestly bullish sign, but there were troubling failures in 1930, 1974, and 2001.
Internal momentum is reversing from severely oversold conditions
More impressively than the price gains, the spurt from the low has been accompanied by a good amount of advancing stocks relative to declining ones.
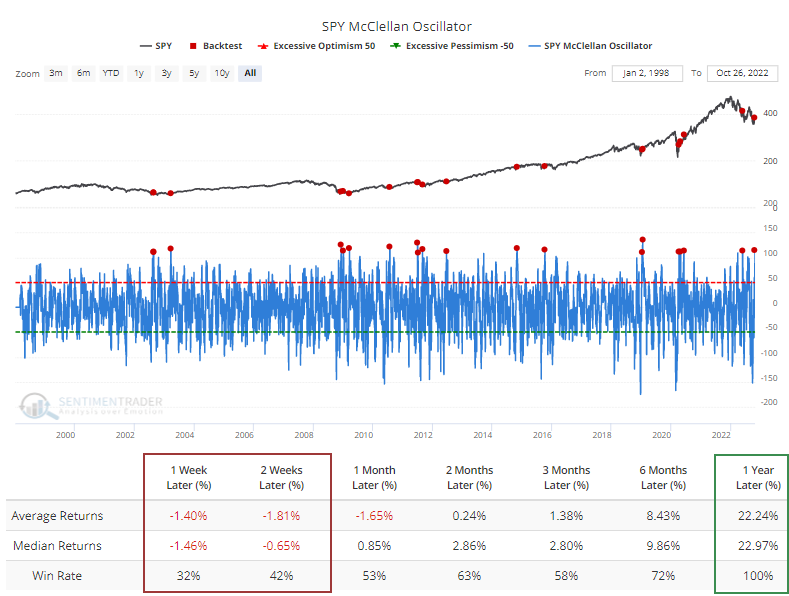
That surge in momentum pushed the McClellan Oscillator for the S&P to one of its highest levels in decades. Anytime it was 110 or above, the Backtest Engine shows weak short-term returns but strong long-term ones.
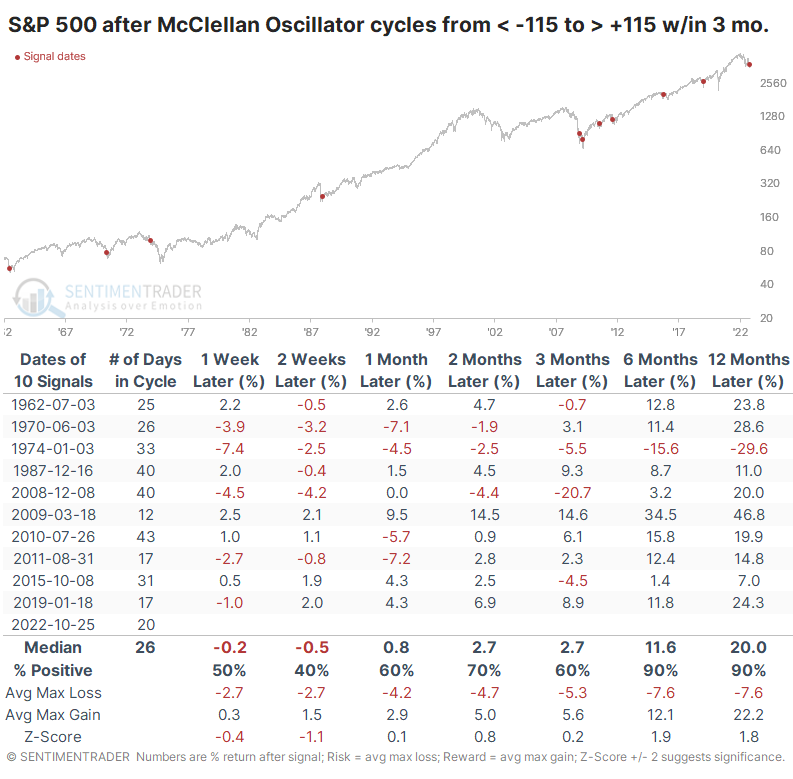
The extremes in the Oscillator have been even more pronounced than that. If we look at the past 60 years, this is one of fewer than a dozen times when the Oscillator cycled from below -115 to above +115 in less than three months. Only 1974 proved to be a false signal of long-term gains.
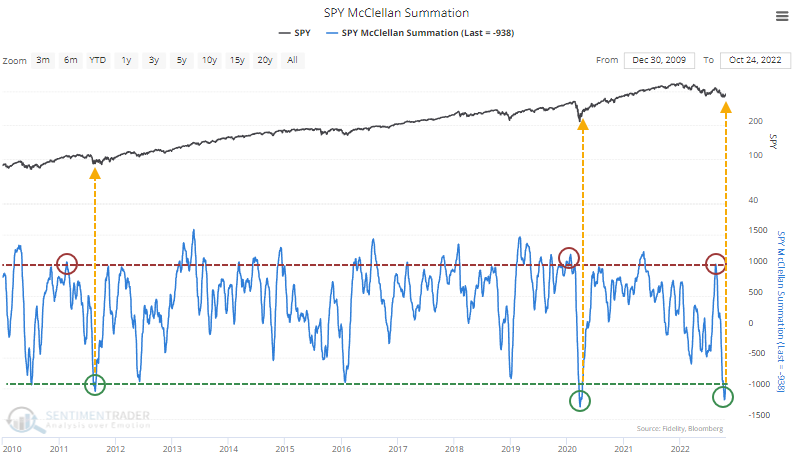
The short-term internal buying interest has been enough to push the S&P's long-term McClellan Summation Index back above -1000 for the first time in a couple of weeks. The nascent recovery comes after the long-term internal momentum indicator cycled from above +1000 to below -1000. In recent years, this only happened in 2011 and 2020.
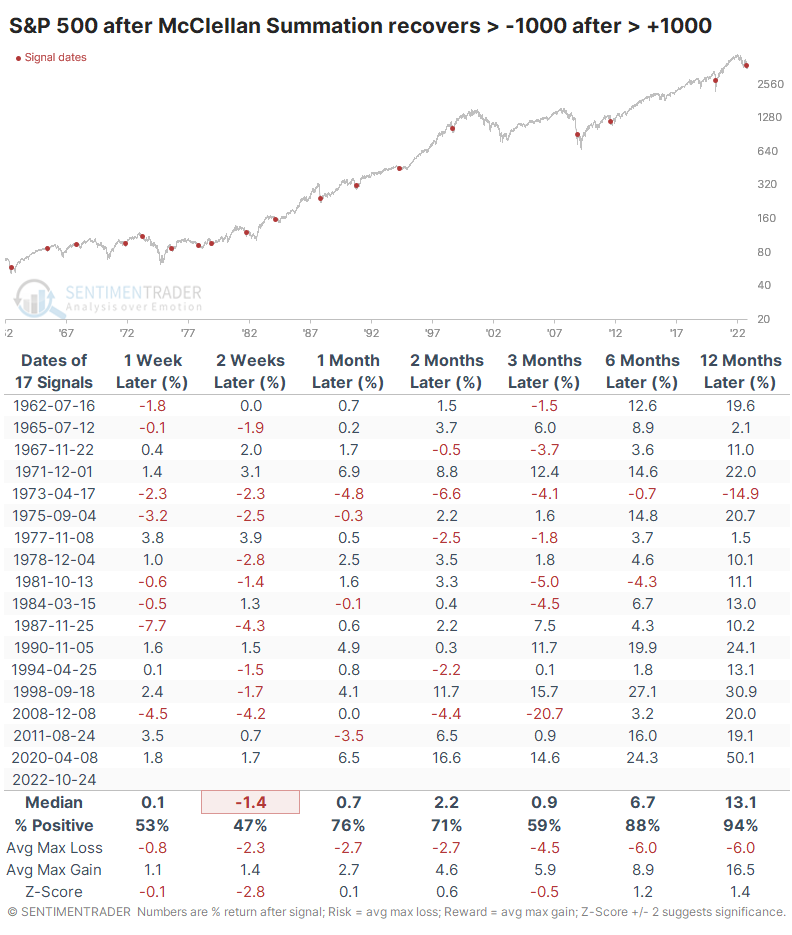
Historically, a push above +1000 has indicated significant buying interest, and when it subsequently drops below -1000, the market is oversold. Watching it move back above -1000 has generally meant the worst of the selling was over. Since 1962, there was essentially only one failure over a medium- to long-term time frame, in 1973.
Insiders have been sitting on their shares
It bears repeating that corporate insiders are among the few investors who haven't been interested in selling stocks. The number of insider selling transactions just dropped to an all-time low. Unfortunately, the "all-time" only extends to 2010.
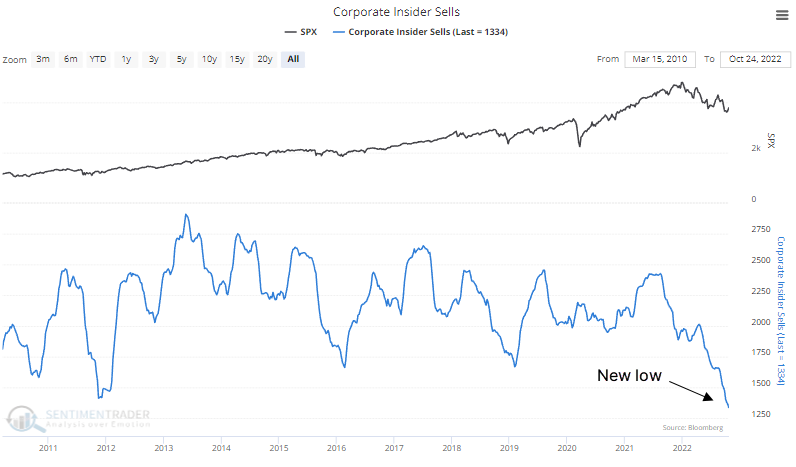
There hasn't been a big spike in buying transactions, which would be a better sign for bulls. But the dramatic drop-off in selling transactions pushed the Buy/Sell Ratio to one of its highest levels since 2010. The Backtest Engine shows that all 43 weeks with this high of a ratio preceded medium- to long-term gains (admittedly, with the tailwind of a sustained bull market).
What the research tells us...
There has been a rash of indications that investors reached a point of maximum pessimism during the latest dump, with prices falling enough to greatly interest short-coverers and bargain-hunting investors. When this happened earlier this year, it was good for a multi-month rally. Conditions like this, even during protracted bear markets, tend to persist for weeks or months at least.