
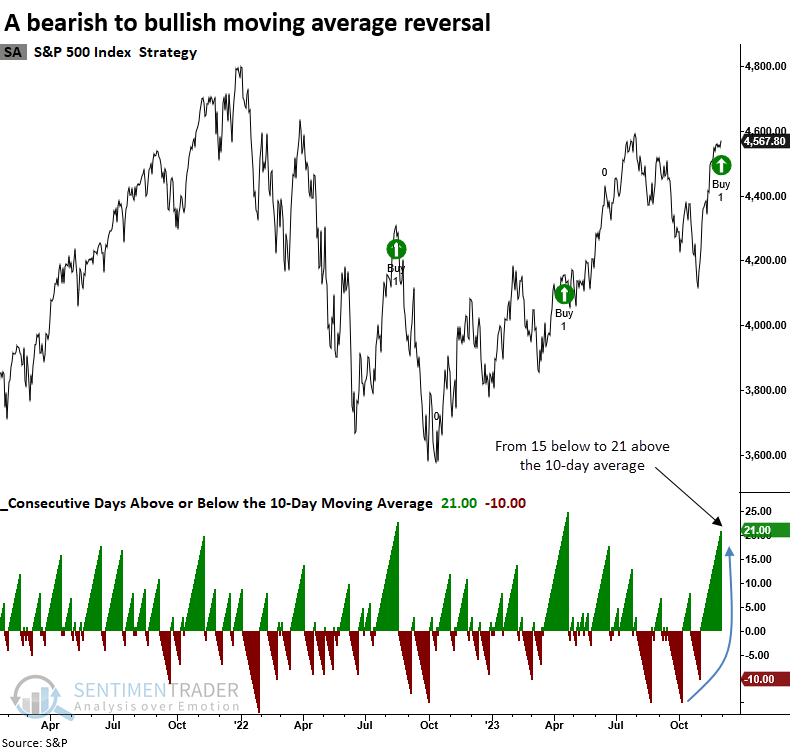
A bearish to bullish moving average reversal

Key points:
- The S&P 500 triggered a bullish alert when it reversed from below to above its 10-day average
- Similar moving average reversals over the past 95 years preceded solid returns and win rates
- Several other sectors and indexes generated alerts, including the Nasdaq Composite
Sustained win streaks above a moving average reflect bull market behavior
A TCTM Composite Confirmation Model component issued a new alert on Thursday when the S&P 500 completed a 10-day moving average bearish to bullish reversal signal.
The model identifies a period when the S&P 500 closed below its 10-day average for a minimum of 12 consecutive sessions. i.e., an oversold condition. Following the completion of the losing streak, the system will initiate a new buy signal when the Index sustains itself above the 10-day average for 21 successive trading days.
The previous signal triggered an alert in April, leading to an almost 10% rally over the subsequent three months.
Similar moving average reversals preceded positive returns
Whenever the S&P 500 cycled from 12 or more consecutive sessions below its 10-day moving average to 21 successive days above the 10-day average, S&P 500 returns and win rates were excellent, especially over medium and long-term horizons.
The system seldom generates alerts in bear markets, given that extended win streaks above a short-term moving average tend to occur in bullish trends. August 2022 was one of the rare exceptions.
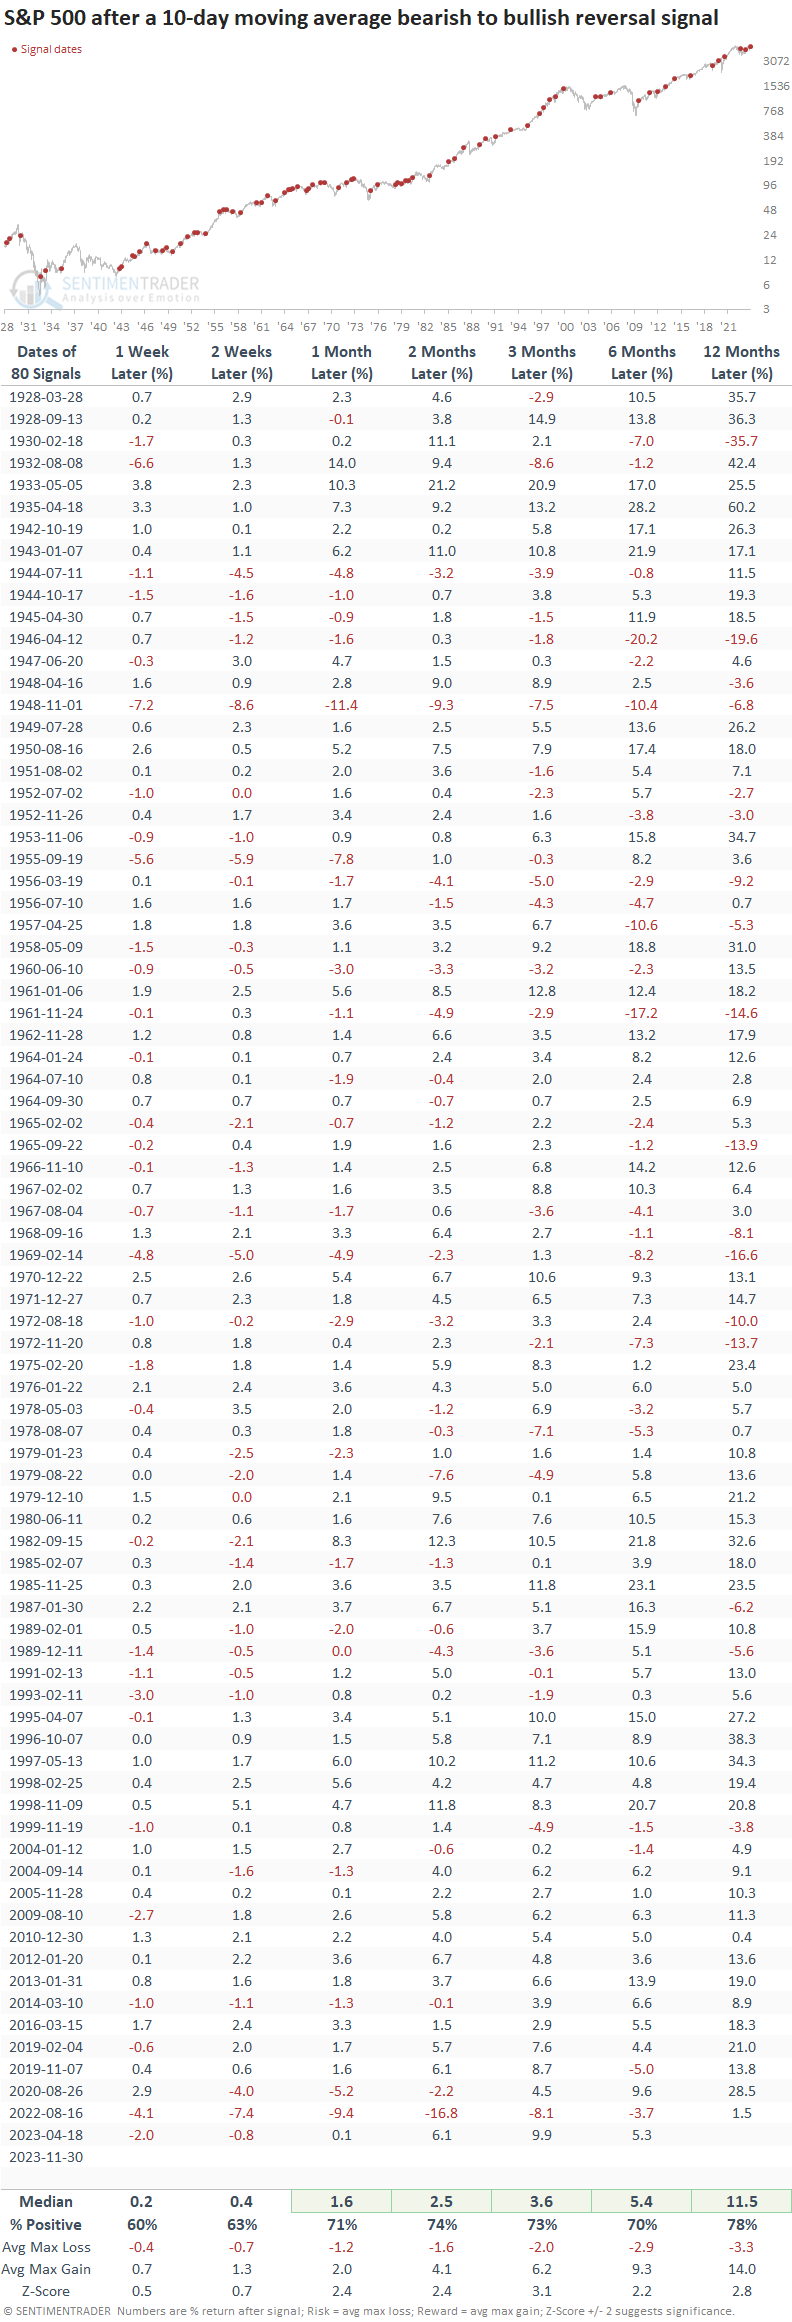
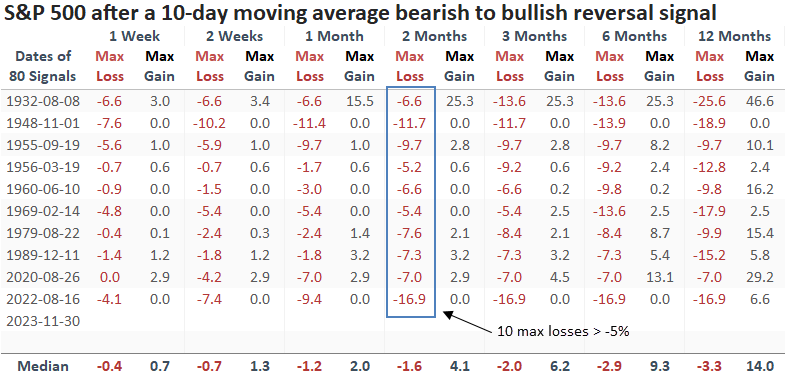
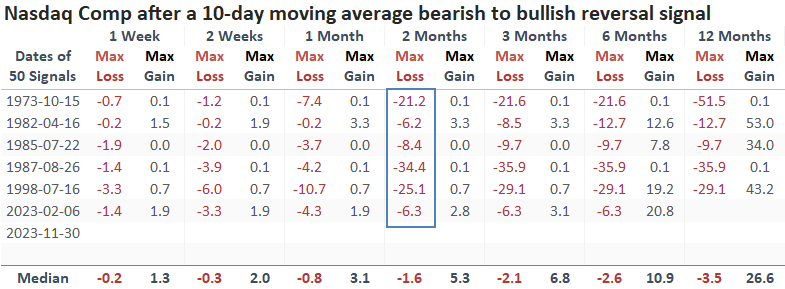
A max loss of more than -5% occurred in 10 of the 80 cases in the subsequent two months. Among these, only two instances demonstrated a loss exceeding -10%.
Additional reversal signals
The Nasdaq Composite generated its second moving average reversal signal since the market low in 2022. In contrast to the S&P 500, the index managed to steer clear of a whipsaw alert last year.
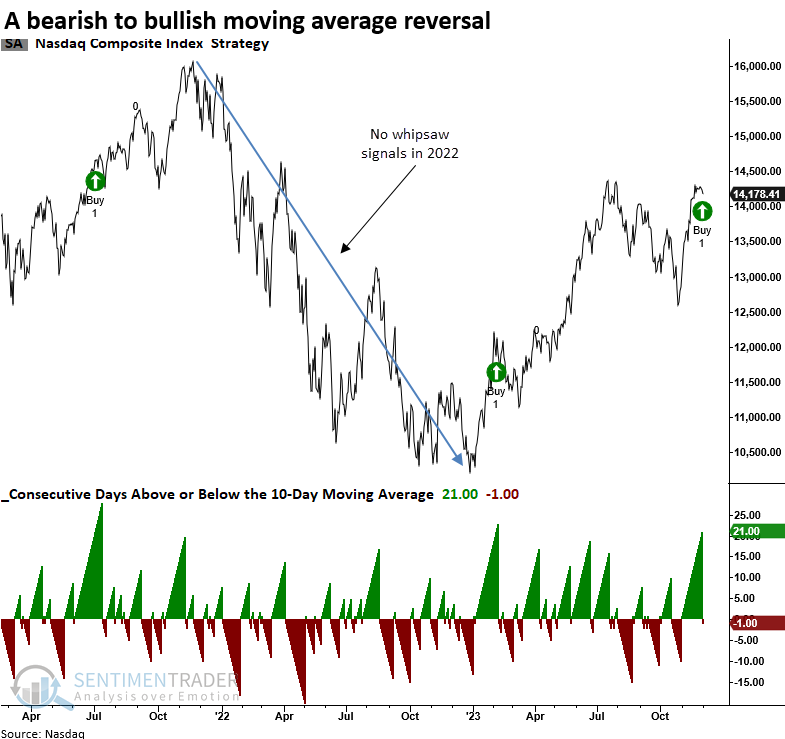
Like the S&P 500, the Nasdaq Composite exhibits excellent results across most time frames when it moves from below to above its 10-day moving average for an extended period.
The system successfully navigated the 2000-02 Nasdaq implosion, avoiding a signal despite several notable countertrend rallies, again underscoring the validity of consistency as a favorable price-based factor.
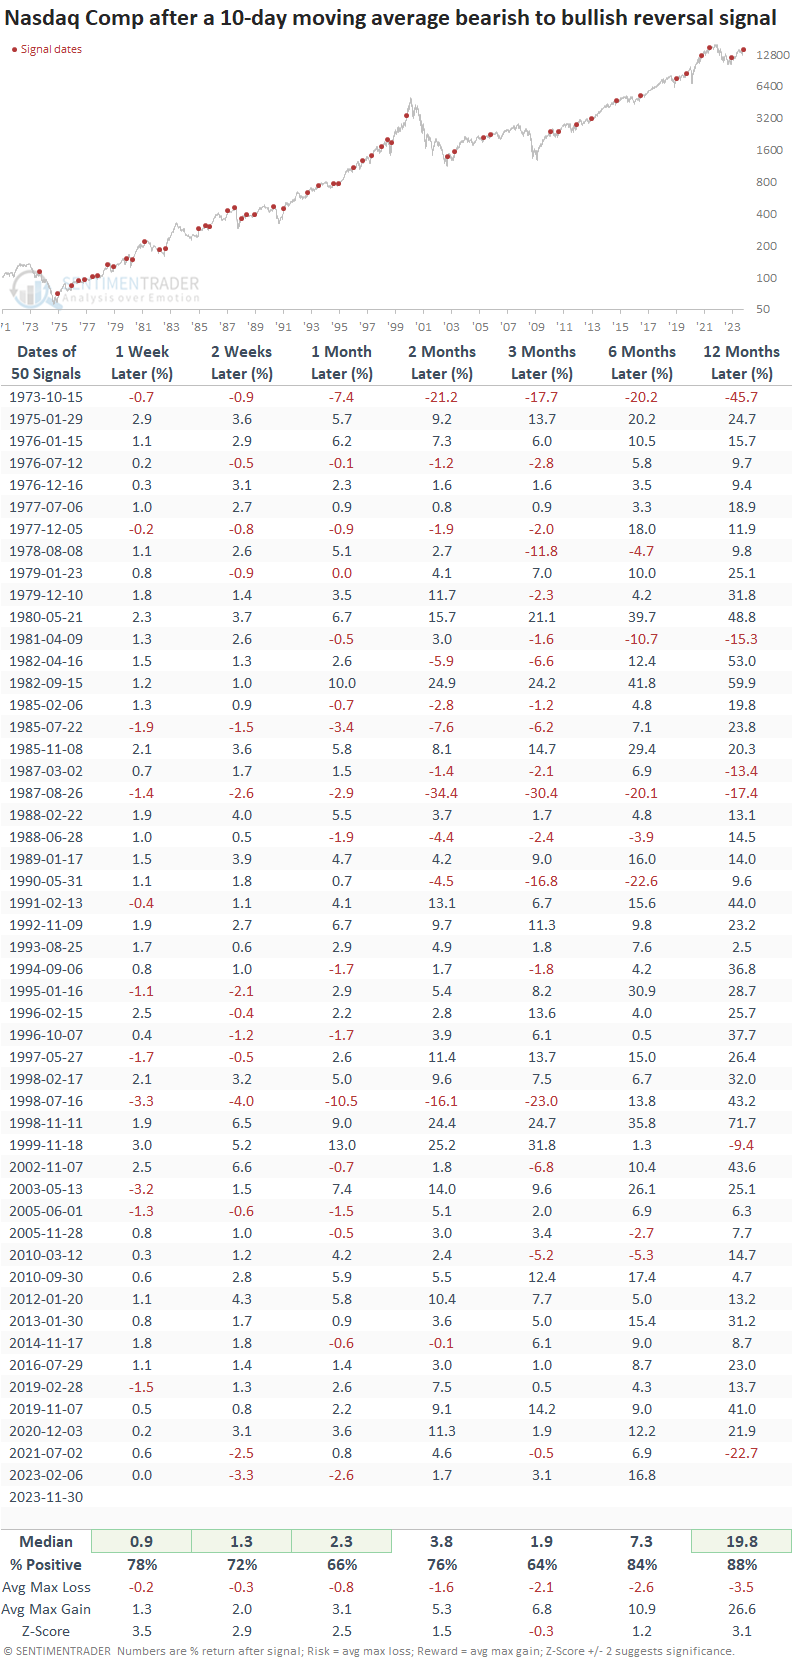
A max loss of more than -5% occurred in 6 of the 50 precedents in the subsequent two months.
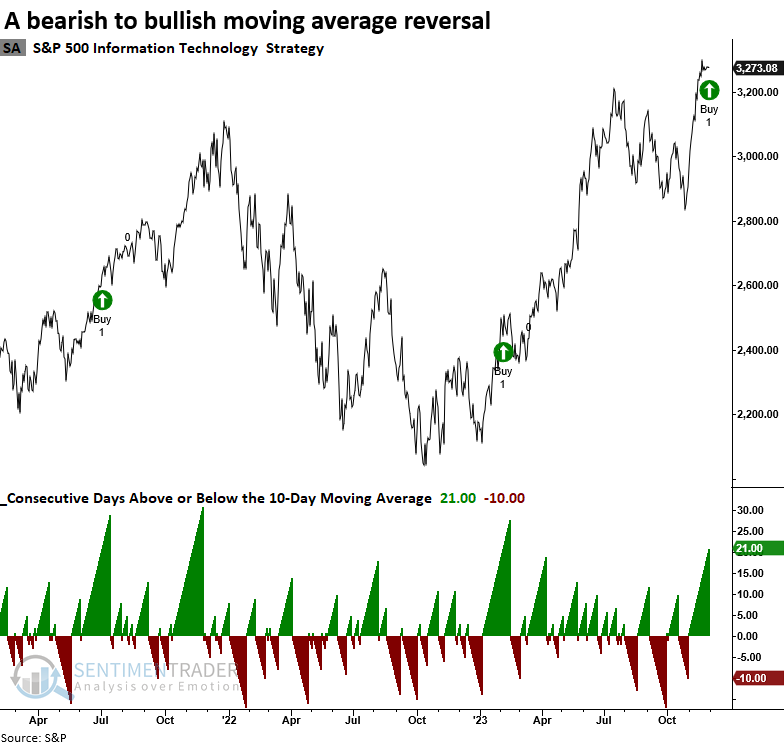
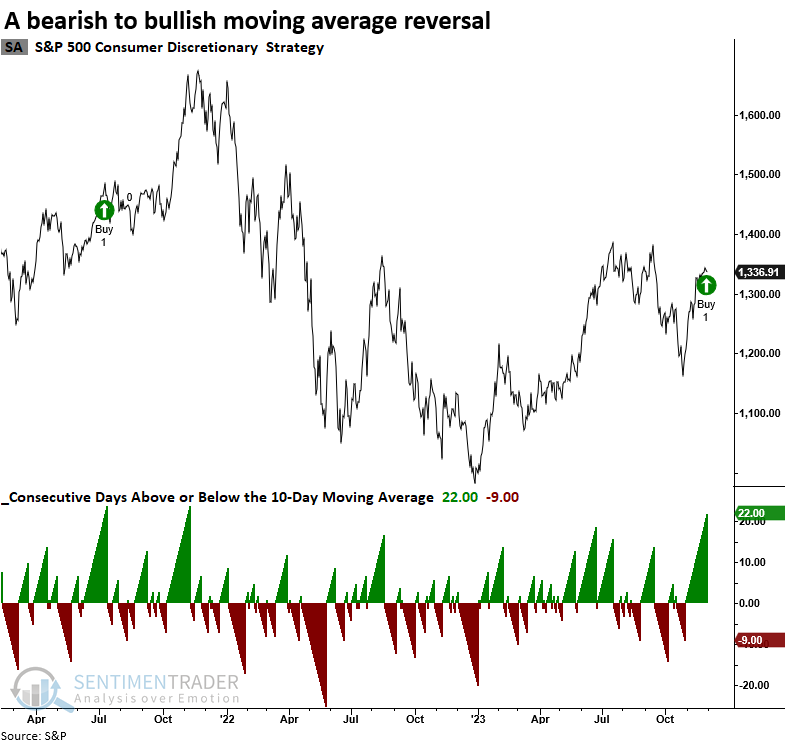
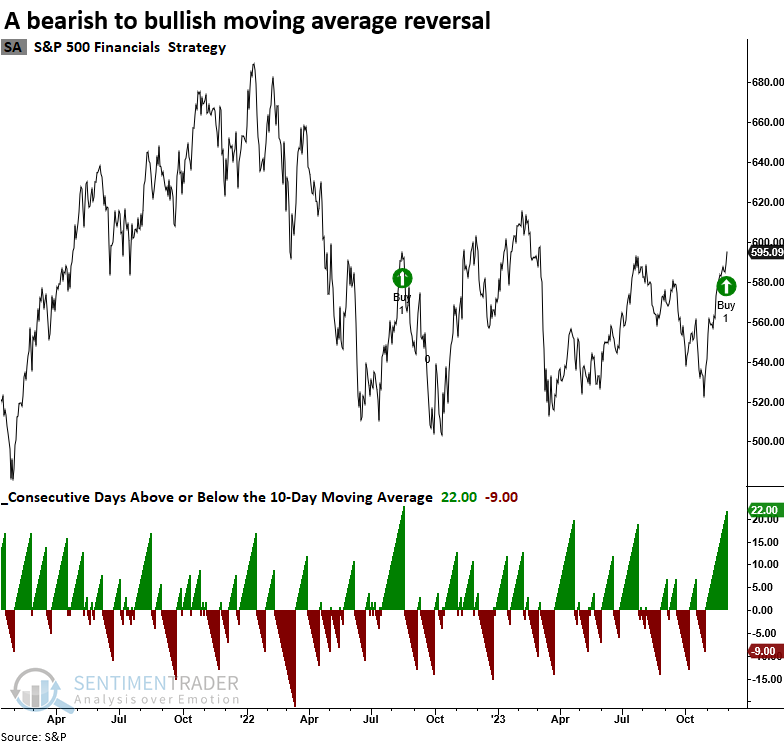
Win streaks have been relatively broad, with the S&P 500 Technology, Consumer Discretionary, and Financials sectors generating moving average reversal alerts.
What the research tells us...
Several indexes and sectors generated moving average reversal buy signals when they closed above their respective 10-day moving averages for 21 consecutive sessions following an extended period below their averages. Similar shifts led to bullish stock market outcomes over medium and long-term horizons.