
A bear market bounce in crude oil or the start of a new uptrend

Key points:
- Crude oil closed higher for six consecutive weeks from a 3-month low
- Similar win streaks suggest additional upside follow-through over the next few months
- Every single S&P 500 energy sector stock outperformed the S&P 500 over the last month
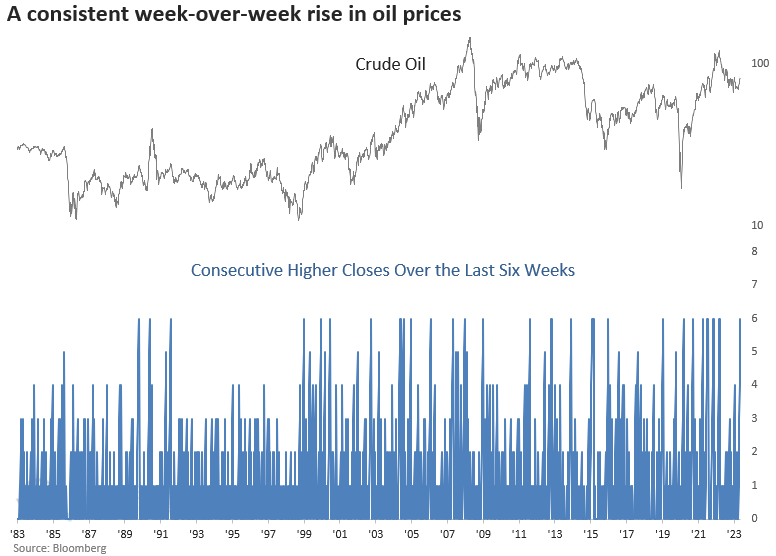
A vitally important and widely watched commodity is on the move again
Crude oil futures are in a clearly defined downtrend, with its 200-day moving average falling for 190 consecutive days, marking the 10th longest streak in history. However, the commodity closed higher for six straight weeks for only the 27th time since 1983.
The prevailing question in investors' minds centers around whether the successive weeks of gains reflect a bear market bounce within a downtrend or the inception of a new uptrend.
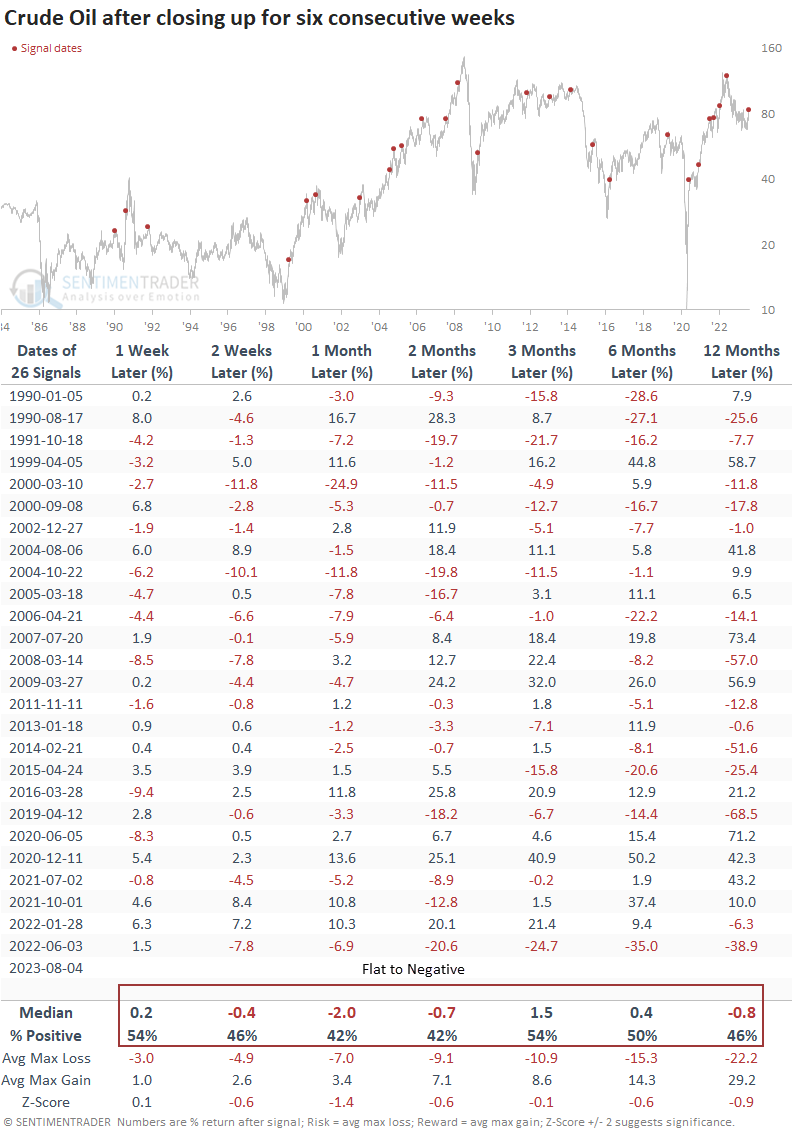
Similar win streaks preceded an unfavorable outlook
A persistent week-over-week rise in oil results in undesirable outcomes, with returns ranging from negative to stagnant for up to a year afterward.
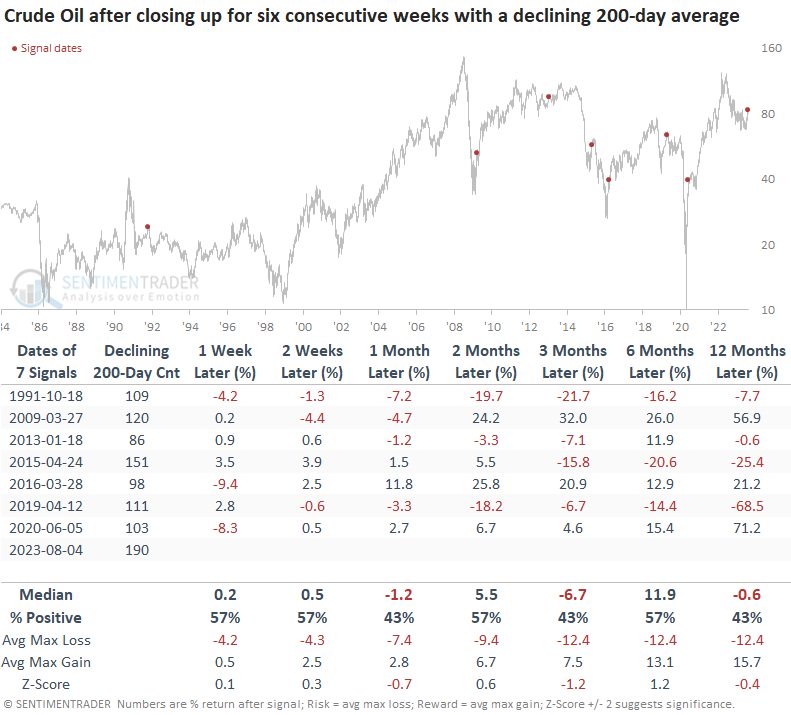
Signals in a downtrend
Suppose I isolated six-week win streaks when the 200-day average for crude oil was declining like now. In that case, the outlook for oil remains unfavorable.
Over the next three months, the commodity was negative at some point every time.
 Additional context
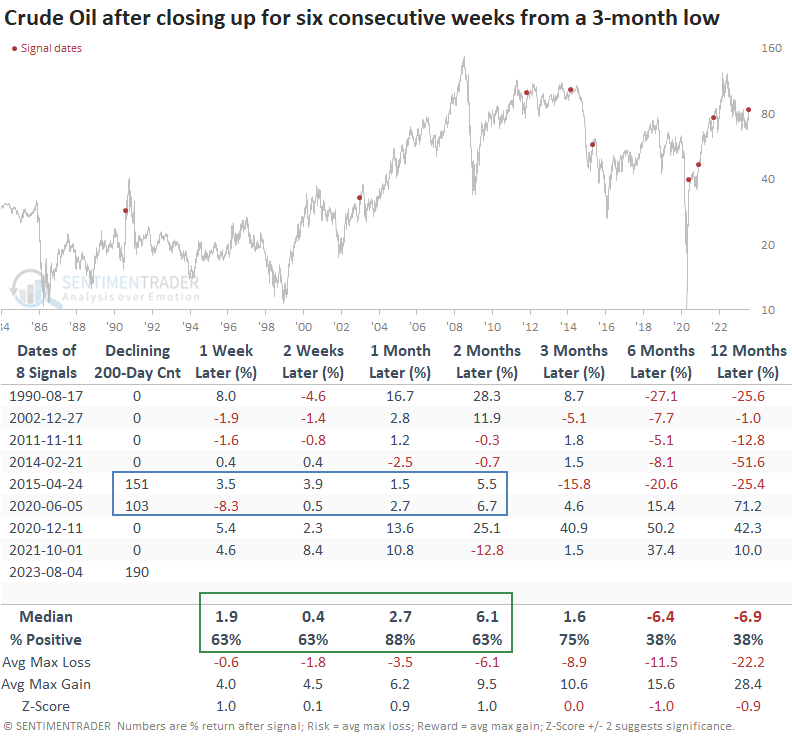
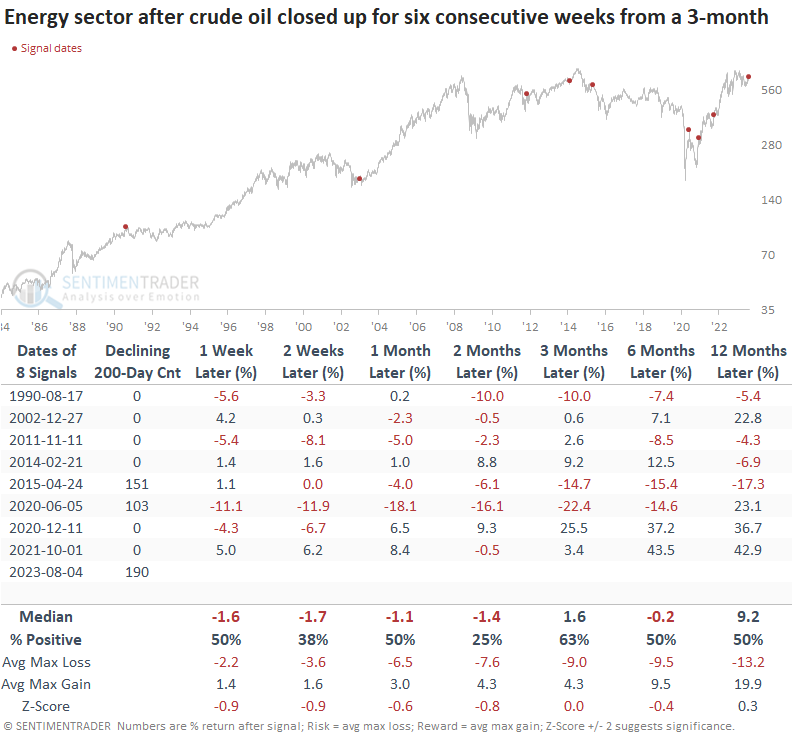
The win streak occurred immediately following a 3-month low in crude oil futures. Let's add that context to the study.
When crude oil futures achieve a string of six consecutive weeks of gains from a low, the favorable price momentum for the commodity tends to maintain itself over the subsequent months. That's also the case when the 200-day is declining, like in 2015 and 2020.
Returns over long-term horizons were abysmal before the COVID drawdown. So, traders might consider oil a short-term rental rather than a long-term position.
When I apply the crude oil signals to the S&P 500 Energy sector, returns and win rates look unfavorable. At some point over the next two months, the energy sector was negative in 7 out of 8 cases.
Did the energy sector signal a turning point?
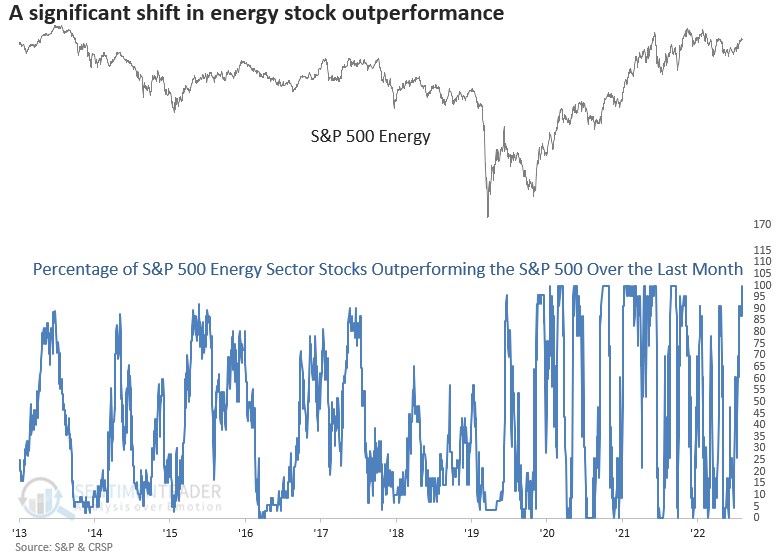
Energy stocks, which have been significant year-to-date laggards, caught a bid from the bounce in oil. For the first time in almost a year, every single S&P 500 Energy stock outperformed the S&P 500 over the last month.
Let's assess the outlook for the energy sector after the percentage of S&P 500 Energy sector stocks outperforming the S&P 500 over the last month cycled from less than 25% to 100%.
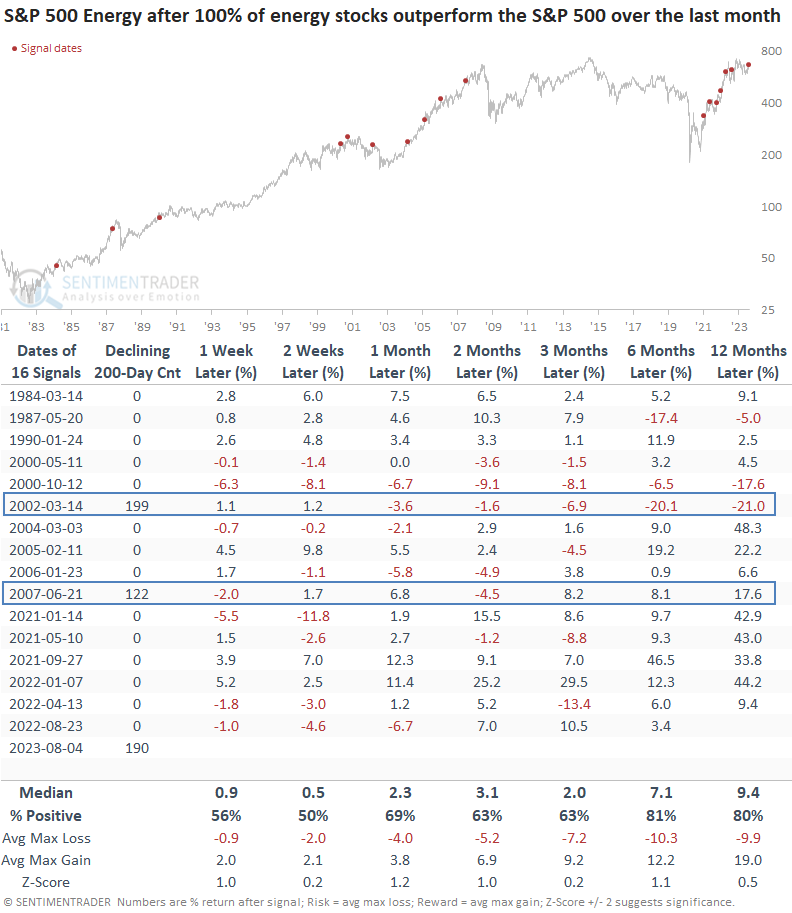
Similar relative performance trends were positive with a caveat
Reversals in the percentage of S&P 500 energy stocks outperforming the S&P 500 tend to exhibit bullish outcomes over most time frames. However, all but two precedents occurred when the 200-day moving average for crude oil was rising, which is not the case now.
In the two prior instances when the moving average was falling, the energy sector declined over the next two months.
What the research tells us...
While crude oil could see some additional upside follow-through, the case for a significant turning point in the commodity and energy stocks does not look compelling based on today's evidence. I'm in the watch-and-wait camp, especially since the broad market is disgesting some of the year-to-date gains.