Products
SentimenTrader Trading Tools
‍
Backtest Engine
My Trading Toolkit
Correlation Analysis
Seasonality
Indicators & Data API
‍
Proprietary Indicators & Charts
Market Data API
Strategies & Scanner
‍
50+ Trading Strategies
Smart Stock Scanner
Research Reports
‍
Research Solutions
Reports Library
Free Resources
Simple Backtest Calculator
Simple Seasonality Calculator
The Kelly Criterion Calculator
Sentiment Geo Map
Public Research Reports
Pricing
Company
About
In the News
Testimonials
Client Success Stories
Contact
Log inLoginSign up
< BACK TO ALL REPORTS

A Backtest Engine Scan to Monitor - The PE/VIX Spread

Jay Kaeppel
2021-08-05
Like many indicators, the PE/VIX Spread swings from low to high and back again over time. Interestingly, it is typically not the exact highs and lows but rather the reversals in the trend that matter the most. With this spread at a high level, the simple Backtest Engine scan detailed in this piece may alert us to impending trouble in the stock market. Now is the time to start paying attention.

I love an indicator that tells you exactly what it is. Take the PE/VIX Spread. Any doubt in your mind what that measures? If so, please note the following from our website:

"This indicator shows the spread between the forward price/earnings multiple on the S&P 500 and the VIX volatility gauge. The higher it is, the more investors are willing to value stocks while not suffering the consequences of high volatility, which tends to lead to poor future returns. A very negative spread shows that investors may be pricing in too great of a swing in prices relative to the earnings that stocks will likely be generating."

In a nutshell, this indicator is where valuation and sentiment meet. The reason I bring it to your attention now is that it may soon be on the cusp of a potentially important signal. And unfortunately, this signal may be "one of the painful kind."

The Test

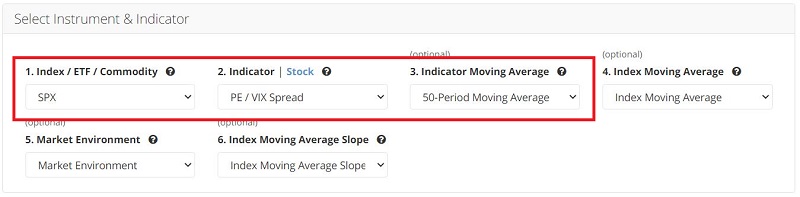
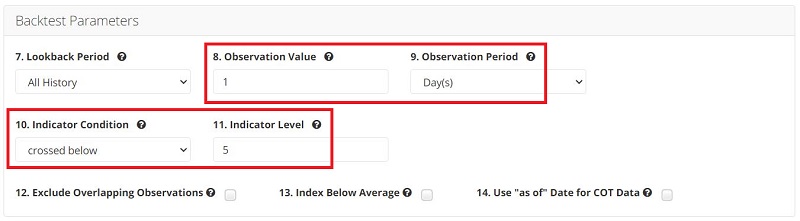
You can run the following test by clicking on this link. What this test looks for is a day when:

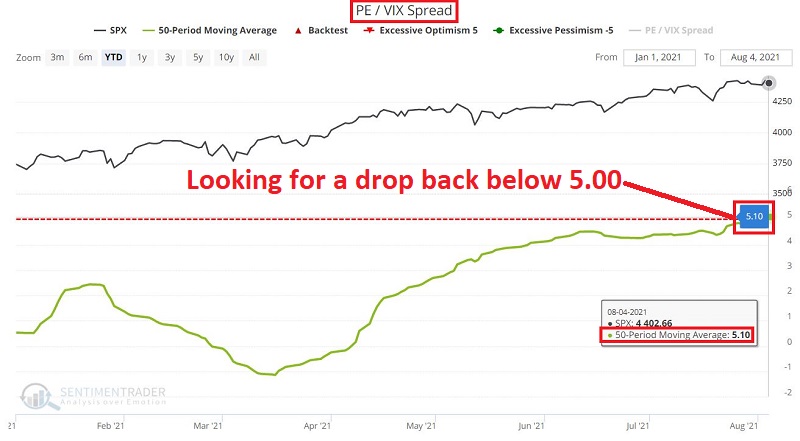
  • The 50-day average of the PE/VIX Spread
  • Drops below 5.00

It doesn't often happen, so a small sample size is a concern. Still, the intermediate-term results seem worth noting.

The input screens appear below.

THE RESULTS

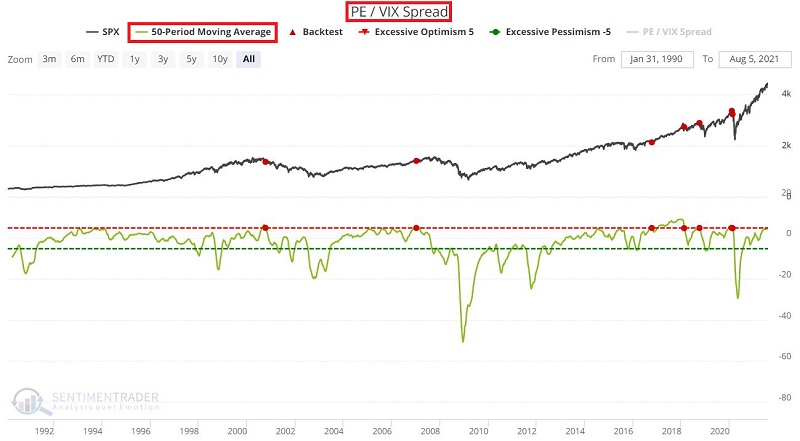
The chart below shows the previous signals from this particular test.

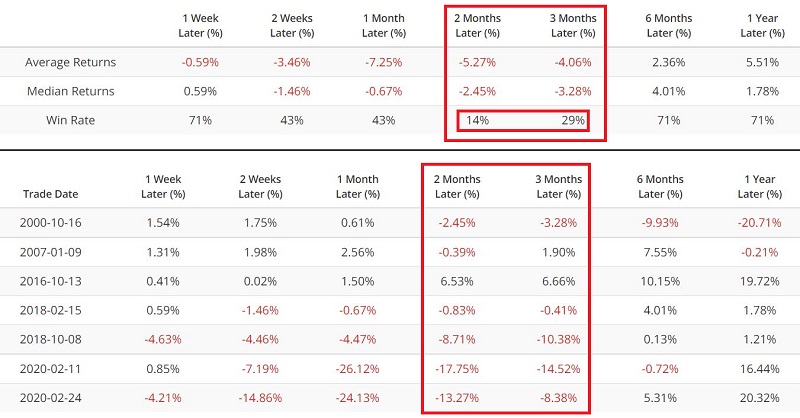
The table below displays the results of previous signals. The key thing to note is the deeply unfavorable results registered 2 months and 3 months after previous signals (although after that, results were much better, so we are talking about an intermediate-term indicator).

CURRENT STATUS

As you can see in the chart below, the PE/VIX Spread 50-day average is presently above 5.00. There is no way to know how long it might be before this measure drops back below 5.00. However, once it does, it might make sense for investors to "play some defense" over the subsequent few months.

You can save this test by:

  • Clicking Add to Favorites
  • Entering a Name (e.g., PE/VIX Spread 50-day MA drops below 5.00)
  • Clicking Save Favorite

Sorry, you don't have access to this report

Upgrade your subscription plan to get access
Go to Dasboard
PRODUCTS
SentimenTrader
Trading Tools
Indicators & Data API
‍
Strategies & Scanner
‍
Research Reports
FREE
RESOUrCES
Simple Backtest
Calculator
Simple Seasonality
Calculator
The Kelly Criterion
Calculator
Sentiment Geo Map
‍
Public Research Reports
‍
Pricing
Bundle pricing
‍
Announcements
‍
FAQ
COMPANY
‍
About
‍
In the News
‍
Testimonials
‍
Client Success Stories
CONTACT
‍
General Inquiries
‍
Media Inquiries
‍
Financial Professionals Inquiries
‍
© 2025 Sundial Capital Research Inc. All rights reserved.
Setsail Marketing
TermsPrivacyAffiliate Program
Risk Disclosure: Futures and forex trading contains substantial risk and is not for every investor. An investor could potentially lose all or more than the initial investment. Risk capital is money that can be lost without jeopardizing ones’ financial security or life style. Only risk capital should be used for trading and only those with sufficient risk capital should consider trading. Past performance is not necessarily indicative of future results.

Hypothetical Performance Disclosure: Hypothetical performance results have many inherent limitations, some of which are described below. No representation is being made that any account will or is likely to achieve profits or losses similar to those shown; in fact, there are frequently sharp differences between hypothetical performance results and the actual results subsequently achieved by any particular trading program. One of the limitations of hypothetical performance results is that they are generally prepared with the benefit of hindsight. In addition, hypothetical trading does not involve financial risk, and no hypothetical trading record can completely account for the impact of financial risk of actual trading. for example, the ability to withstand losses or to adhere to a particular trading program in spite of trading losses are material points which can also adversely affect actual trading results. There are numerous other factors related to the markets in general or to the implementation of any specific trading program which cannot be fully accounted for in the preparation of hypothetical performance results and all which can adversely affect trading results.

Testimonial Disclosure: Testimonials appearing on this website may not be representative of other clients or customers and is not a guarantee of future performance or success.