Products
SentimenTrader Trading Tools
‍
Backtest Engine
My Trading Toolkit
Correlation Analysis
Seasonality
Market Prediction
Indicators & Data API
‍
Proprietary Indicators & Charts
Market Data API
Strategies & Scanner
‍
50+ Trading Strategies
Smart Stock Scanner
Smart Option Scanner
Research Reports
‍
Research Solutions
Reports Library
Free Resources
Simple Backtest Calculator
Simple Seasonality Calculator
The Kelly Criterion Calculator
Sentiment Geo Map
Public Research Reports
Education
Sentiment Indicators
Technical Indicators
Pricing
Company
About
In the News
Testimonials
Client Success Stories
Contact
Log inLoginSign up
< BACK TO ALL REPORTS

A 19-Year Low In Stock Holdings?

Jason Goepfert
2016-04-21
null

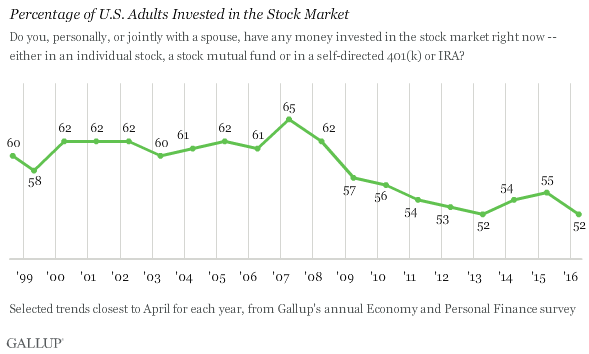
Americans are holding the fewest stocks in 19 years. So says a new Reuters poll, getting quite a bit of attention today.

But...

  1. It's a survey. People often do one thing and say another. Many don't even know that they own stocks.
  2. It might be misleading. The survey included about 1,000 respondents and there was a sampling error of +/- 4%. The headline number was that 52% of respondents own stocks, but the real number could be as high as 56%, which would be the highest since 2010.
  3. Even if it's accurate, it doesn't tell the whole story. Even if fewer Americans are holding stocks, that doesn't mean Americans in general are under-exposed. It just means that stockholdings are concentrated among fewer individuals. Is that a good thing? Forgetting the social aspect, what happens if stocks start to decline? Instead of the market being somewhat cushioned by having a broad base, it's concentrated in relatively few hands and if those hands decide to fold, then a sell-off would feed on itself.
  4. It may not work. If we were using this survey as a contrary indicator, then we might have been bullish in 1999 (when fewer Americans said they owned stocks) and bearish in 2002 (when a then-record high owned them).
  5. It's a survey. That bears repeating. Instead of looking at what people say, we much prefer to look at what they do. So let's look at a couple of charts - using real money - that show how Americans are actually positioned.

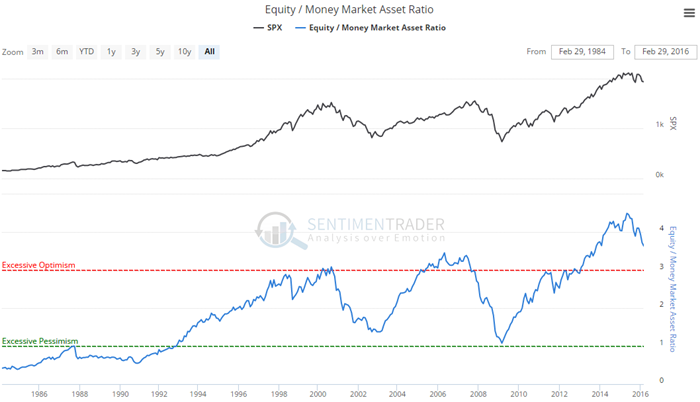
According to the Investment Company Institute, American households are now holding about 3.5 times more assets in stocks than they are in "safe" money market funds. That's down significantly from the peak in 2015 but is still higher than every other peak in 30 years.

20160421_cash_equity_mmkt

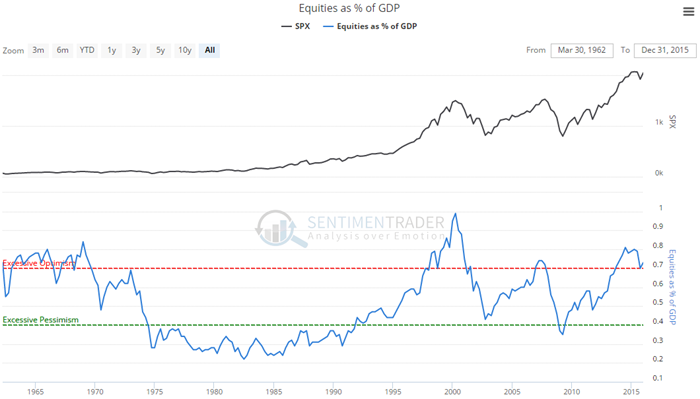
According to the Federal Reserve, household stock holdings are worth more than 70% of the U.S. GDP. That ranks among the highest levels in 50 years.

20160421_cash_equity_gdp

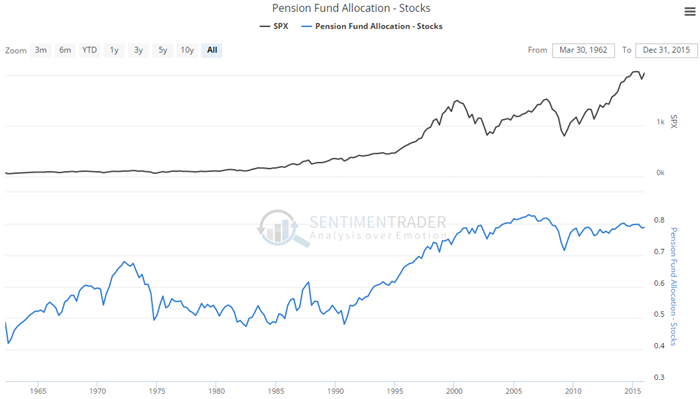
As mentioned earlier, many people don't realize they're actually holding stocks. From automatic 401k contributions to company pension funds, workers often make contributions that are automatically invested and they "set it and forget it". And those pension funds are holding nearly 80% of their (stock/bond/cash) assets in stocks.

20160421_cash_equity_pension


Bottom line, it's often better to ignore surveys, especially ones with relatively small sample sizes and limited history, and instead focus on actual money. By most real-money measures, Americans are holding a near-record amount of stocks relative to other assets.

PRODUCTS
SentimenTrader
Trading Tools
Indicators & Data API
‍
Strategies & Scanner
‍
Research Reports
FREE
RESOUrCES
Simple Backtest
Calculator
Simple Seasonality
Calculator
The Kelly Criterion
Calculator
Sentiment Geo Map
‍
Public Research Reports
‍
Education
Sentiment Indicators
‍
Technical Indicators
‍
Pricing
Bundle pricing
‍
FAQ
‍
Announcements
‍
COMPANY
‍
About
‍
In the News
‍
Testimonials
‍
Client Success Stories
CONTACT
‍
General Inquiries
‍
Media Inquiries
‍
Financial Professionals Inquiries
‍
© 2026 Sundial Capital Research Inc. All rights reserved.
Setsail Marketing
TermsPrivacyAffiliate Program
Risk Disclosure: The information and tools provided are for research and analytical purposes only and are not intended as investment advice. Market analysis involves uncertainty, and outcomes may differ from expectations. Users should conduct their own due diligence and consider their individual circumstances before making any financial decisions. Past performance is not necessarily indicative of future results.

Hypothetical Performance Disclosure: Hypothetical performance results have many inherent limitations, some of which are described below. No representation is being made that any account will or is likely to achieve profits or losses similar to those shown; in fact, there are frequently sharp differences between hypothetical performance results and the actual results subsequently achieved by any particular trading program. One of the limitations of hypothetical performance results is that they are generally prepared with the benefit of hindsight. In addition, hypothetical trading does not involve financial risk, and no hypothetical trading record can completely account for the impact of financial risk of actual trading. for example, the ability to withstand losses or to adhere to a particular trading program in spite of trading losses are material points which can also adversely affect actual trading results. There are numerous other factors related to the markets in general or to the implementation of any specific trading program which cannot be fully accounted for in the preparation of hypothetical performance results and all which can adversely affect trading results.

Testimonial Disclosure: Testimonials appearing on this website may not be representative of other clients or customers and is not a guarantee of future performance or success.