
52-week lows on the NYSE are starting to expand again

Key points:
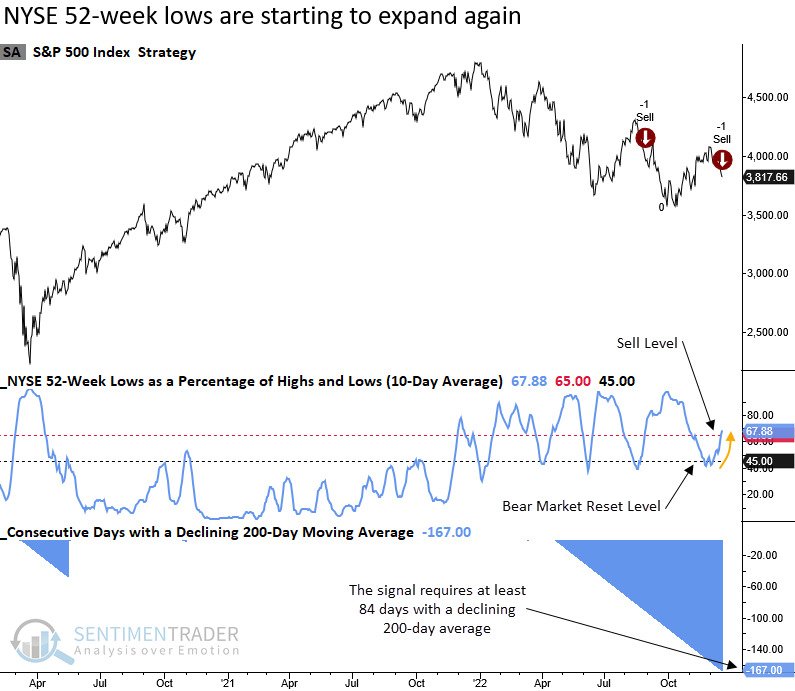
- The 10-day average of NYSE 52-week lows as a % of highs and lows cycled from < 45% to > 65%
- The reversal in lows relative to highs occurred within the context of a downtrend
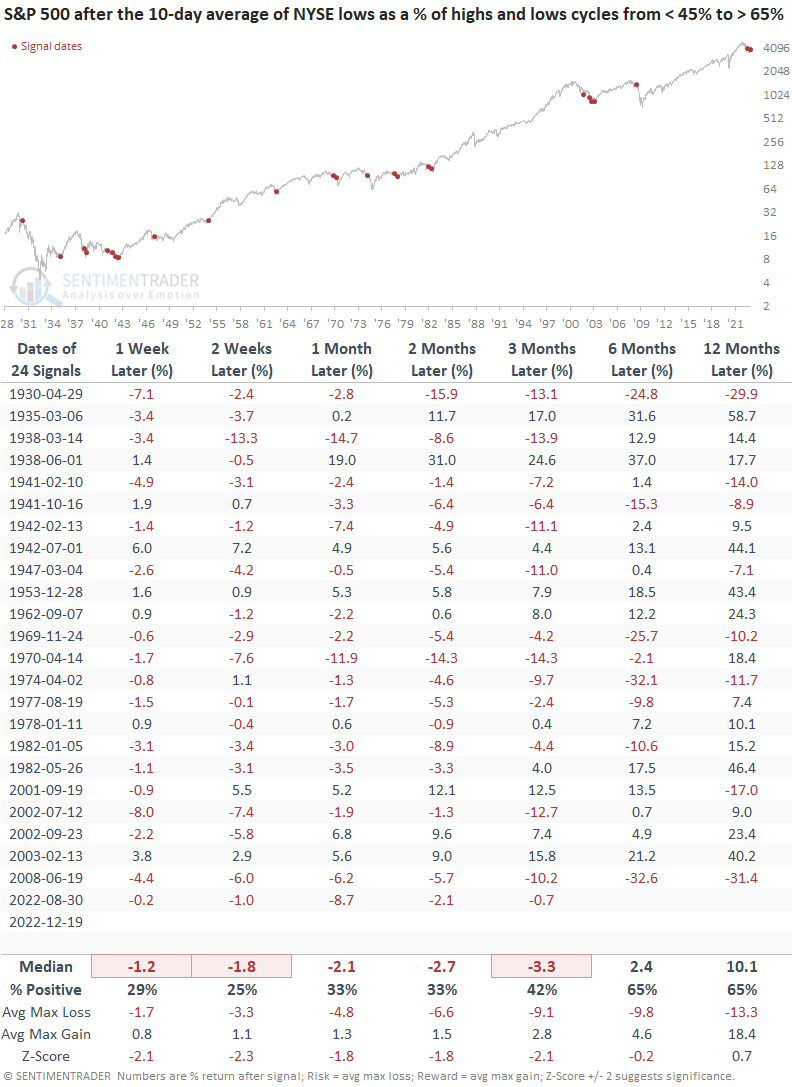
- After similar signals, the S&P 500 struggled across short and medium-term time frames
A bearish breadth-based reversal in an established downtrend
Until now, faltering price action and momentum were mostly contained at the index level. Unfortunately, market breadth indicators are starting to reverse after the multi-month rally from the October low.
One such measure, the 10-day average of NYSE 52-week lows as a percentage of highs and lows, cycled from < 45% to > 65%, triggering the second risk-off signal in 2022.
The uptick in new lows relative to new highs in an established downtrend is troubling as the weight of the evidence is starting to favor the bears again.
Similar reversals in new lows relative to new highs preceded negative returns
When the 10-day average of NYSE lows as a percentage of highs and lows cycle from 45% to > 65% in a downtrend, stocks struggle across short to medium-term time frames. The signal shows a loss at some point over the next two months in 22 out of 24 cases.
Stuck in no man's land
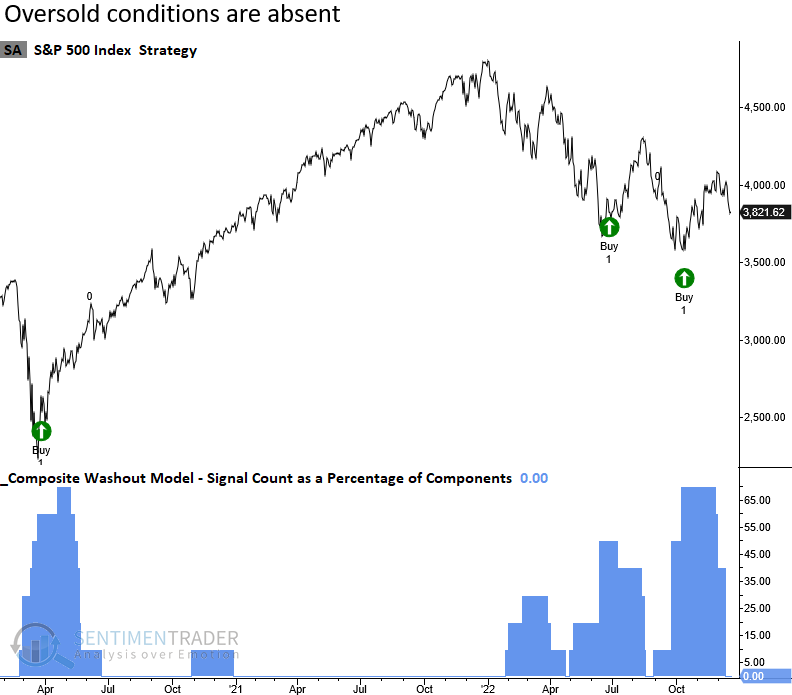
On a closing basis, the S&P 500 has fallen roughly 6% over the last few weeks. While the overbought condition has been relieved, we find ourselves stuck in no man's land as the retreat has yet to produce a meaningful oversold condition.
The TCTM Composite Washout Model count shows zero components on an oversold alert.
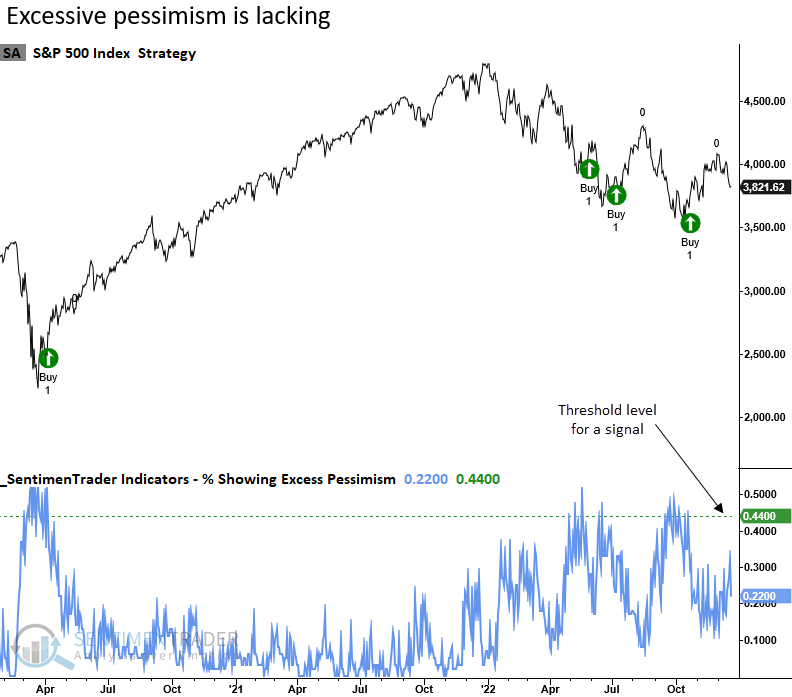
Suppose we focus on a composite that measures a broader number of indicators. In that case, the SentimenTrader % showing excess pessimism model remains well below the threshold level for a signal.
What the research tells us...
In recent notes, I shared some warning signs that suggested one should be mindful of a potential retracement or even retest of the October low. The weight of the evidence continues to build in favor of the bears as NYSE 52-week lows are starting to expand again. After similar signals, the S&P 500 traded lower over the next two months in 22 out of 24 cases.