Products
SentimenTrader Trading Tools
‍
Backtest Engine
My Trading Toolkit
Correlation Analysis
Seasonality
Indicators & Data API
‍
Proprietary Indicators & Charts
Market Data API
Strategies & Scanner
‍
50+ Trading Strategies
Smart Stock Scanner
Research Reports
‍
Research Solutions
Reports Library
Free Resources
Simple Backtest Calculator
Simple Seasonality Calculator
The Kelly Criterion Calculator
Sentiment Geo Map
Public Research Reports
Education
Sentiment Indicators
Technical Indicators
Pricing
Company
About
In the News
Testimonials
Client Success Stories
Contact
Log inLoginSign up
< BACK TO ALL REPORTS

3 Reasons to be Concerned About Bitcoin's Prospects

Jason Goepfert
2021-05-26
A measure of volatility for bitcoin, using a synthetic VIX, shows one of the largest spikes in its history.

Cryptocurrencies have had one of the most explosive weeks in years.

After a plunge, recovery, plunge, and another recovery, traders became pessimistic enough to push some sentiment gauges to their lowest level in a year or more, which is already leading to a short-term bounce.

More than any other factor, volatility drives sentiment, especially in this market. So if we focus on that, we can get a handle on similar conditions.

One of the better ways to do this is to use the same calculations to create a synthetic VIX for stocks, which we last discussed in July. The calculation is based on five different models using open-high-low-close data.

This isn't as clean for crypto because there isn't necessarily a good cutoff point to determine trading sessions. We rely on Bloomberg's data of the Bitcoin/USD cross rate to determine session times.

When we use these models to craft a synthetic VIX, it spits out a number that has been matched few times in bitcoin's history, at just over 200%.

Bitcoin volatility synthetic VIX

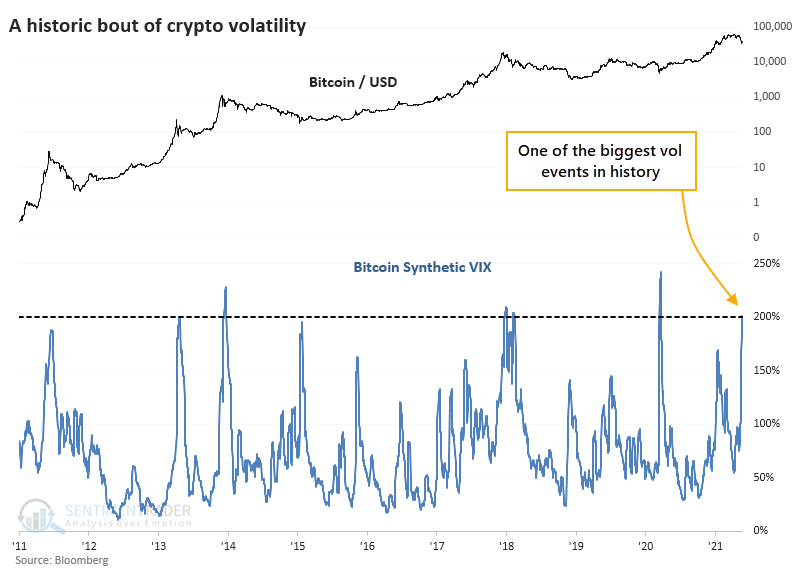
The only time that a volatility event like this marked a bottom was in March 2020, at the height of pandemic-related liquidations. That came after eight months of selling pressure, while this one did not - crypto markets were hitting record highs only a month ago.

There were three other times when bitcoin was recently at a peak, and then volatility spiked, twice in 2013, then again in 2017. All three preceded large and persistent losses for the coin.

Stat Box

Our Optimism Index Geo-Map shows that among all countries, investors are the least optimistic about Chile. Its 20-day Optimism Index just dropped below 25. Over the history of the ECH fund, our Backtest Engine shows 9 other signals. It was too early during the pandemic, and outright failed in 2013. But the 7 other signals all preceded rallies over the next two months averaging more than 7%.


What else we're looking at

  • Full details following volatility spikes in bitcoin
  • What happened after long uptrends in bitcoin came to an end
  • Returns following bouts of extreme short-term bitcoin pessimism
  • A measure that shows a new extreme in corn
  • A way to take advantage of a QQQ Bollinger Band signal using options
  • Stocks in Taiwan have triggered another notable trading signal
PRODUCTS
SentimenTrader
Trading Tools
Indicators & Data API
‍
Strategies & Scanner
‍
Research Reports
FREE
RESOUrCES
Simple Backtest
Calculator
Simple Seasonality
Calculator
The Kelly Criterion
Calculator
Sentiment Geo Map
‍
Public Research Reports
‍
Education
Sentiment Indicators
‍
Technical Indicators
‍
Pricing
Bundle pricing
‍
FAQ
‍
Announcements
‍
COMPANY
‍
About
‍
In the News
‍
Testimonials
‍
Client Success Stories
CONTACT
‍
General Inquiries
‍
Media Inquiries
‍
Financial Professionals Inquiries
‍
© 2025 Sundial Capital Research Inc. All rights reserved.
Setsail Marketing
TermsPrivacyAffiliate Program
Risk Disclosure: Futures and forex trading contains substantial risk and is not for every investor. An investor could potentially lose all or more than the initial investment. Risk capital is money that can be lost without jeopardizing ones’ financial security or life style. Only risk capital should be used for trading and only those with sufficient risk capital should consider trading. Past performance is not necessarily indicative of future results.

Hypothetical Performance Disclosure: Hypothetical performance results have many inherent limitations, some of which are described below. No representation is being made that any account will or is likely to achieve profits or losses similar to those shown; in fact, there are frequently sharp differences between hypothetical performance results and the actual results subsequently achieved by any particular trading program. One of the limitations of hypothetical performance results is that they are generally prepared with the benefit of hindsight. In addition, hypothetical trading does not involve financial risk, and no hypothetical trading record can completely account for the impact of financial risk of actual trading. for example, the ability to withstand losses or to adhere to a particular trading program in spite of trading losses are material points which can also adversely affect actual trading results. There are numerous other factors related to the markets in general or to the implementation of any specific trading program which cannot be fully accounted for in the preparation of hypothetical performance results and all which can adversely affect trading results.

Testimonial Disclosure: Testimonials appearing on this website may not be representative of other clients or customers and is not a guarantee of future performance or success.