
3 keys align for commodities

Key Points
- Commodities have been heating up
- A commodity price index is in an uptrend, with favorable cycles and seasonality
- This confluence suggests investors continue to focus on the bullish side of commodities
Commodities have been heating up
Investors have been hearing about the potential for a commodities supercycle for years. Finally, there is some evidence that they're right.
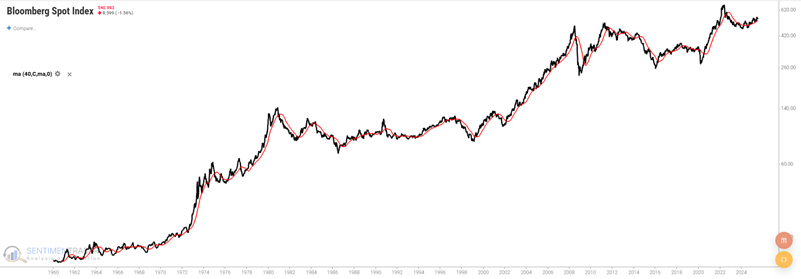
The Bloomberg Commodity Spot Price Index (BCOMSP) is a broad-based index of commodity performance. Below, we see a logarithmic chart of BCOMSP since 1960, along with a 40-week moving average.
The bulk of major advances in the index occur when it is above the 40-week average, as it is now. The index bottomed in February 2024 and has rallied almost 17% since, which is a fraction better than the S&P 500.
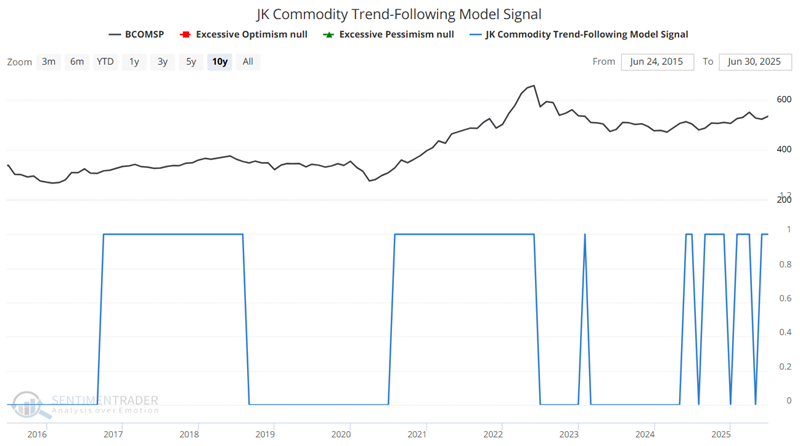
In a pair of articles in March (here and here), I highlighted the JK Commodity Trend-Following Model Signal, which objectively designates the trend for commodities as favorable or unfavorable. This model has jumped around a bit recently, but is presently favorable. Model readings of 1 are favorable for commodities, and zero are unfavorable.
Cycles and seasonality
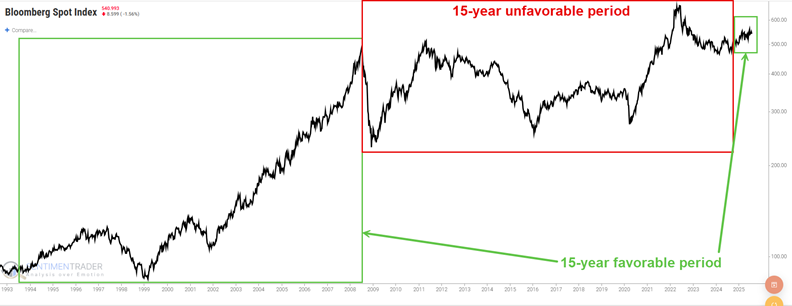
In a series of notes in 2023, I highlighted the 30-year cycle in commodities (see here, here, here, and here). This cycle tends to see commodities advance significantly and outperform stocks for 15 years, followed by 15 years of underperformance.
The last several 15-year segments can be seen below. If this 30-year cycle remains valid, we should expect commodities to continue trending higher over the next thirteen years.
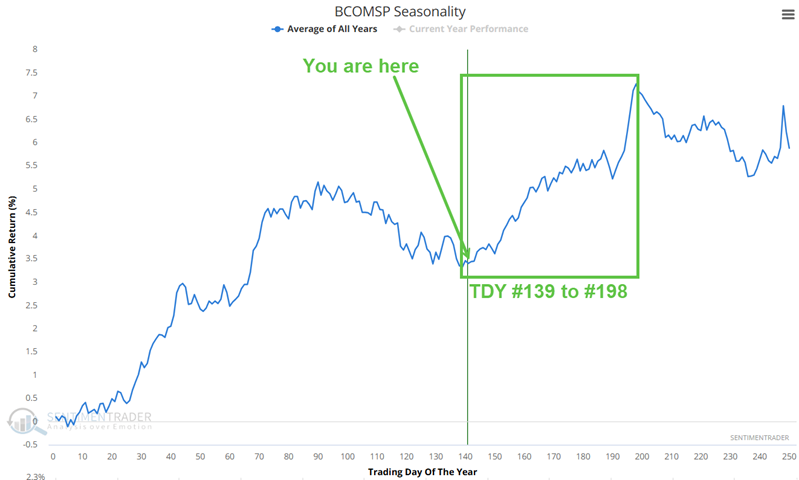
The Annual Seasonal Trend chart for BCOMSP shows the average performance on the index across the calendar year. The index has entered one of its most favorable seasonal periods, extending from Trading Day of the Year (TDY) #139 through TDY #198. For 2025, this period extends from July 23rd through October 15th.
The chart below shows the hypothetical growth of $1 invested in this index only during this period every year starting in 1960, with a clear up-and-to-the-right shape.
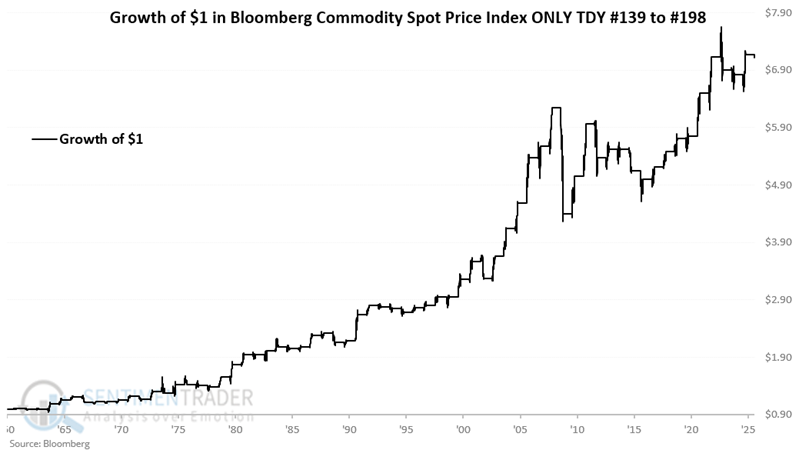
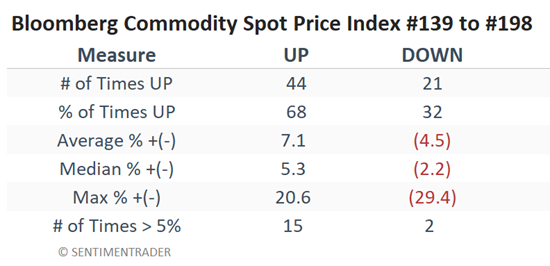
A 68% Win Rate suggests that commodities rise during this period roughly two out of every three years, so it's not a sure thing. However, average and median gains are significantly better than average and median losses, and the number of moves greater than 5% skews heavily to the positive side.
ETF proxies
In the past, traders and investors who wanted exposure to commodities had to buy a basket of commodities futures contracts or shares of stocks whose primary business was related to commodities.
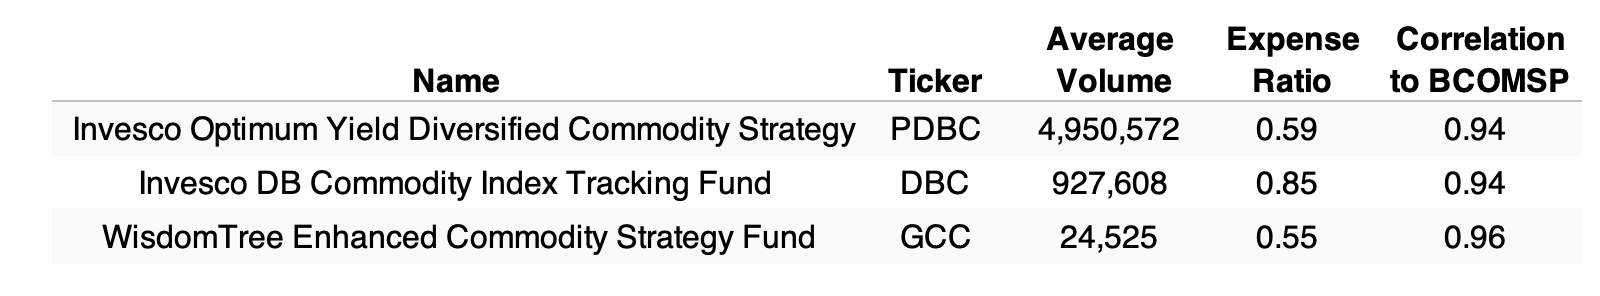
Now, various ETFs are available to track a basket of commodities. Each of the ETFs listed in the table below has its unique methodology for weighting the holdings in its portfolio, and investors are encouraged to do their due diligence.
GCC has the highest correlation to BCOMSP (0.966), but has significantly lower trading volume than the other two. PDBC and DBC are also highly correlated with BCOMSP and are viable alternatives. PDBC enjoys substantially higher trading volume and a lower expense ratio. In addition, for tax-conscious investors, PDBC does not issue a Form K-1 at the end of the year.
What the research tells us...
Commodities have several important factors working for them at the moment. First and foremost, price is in an uptrend. Secondly, the 30-year cycle turned favorable at the end of June 2023 and will remain so for 13 years. Finally, the annual seasonal trend is entering the most favorable time of the year. None of this guarantees a rip-roaring rally - or any rally at all - in the months ahead, but history suggests that is the highest probability.