
3 classic cyclical sectors lead to record highs

Key points:
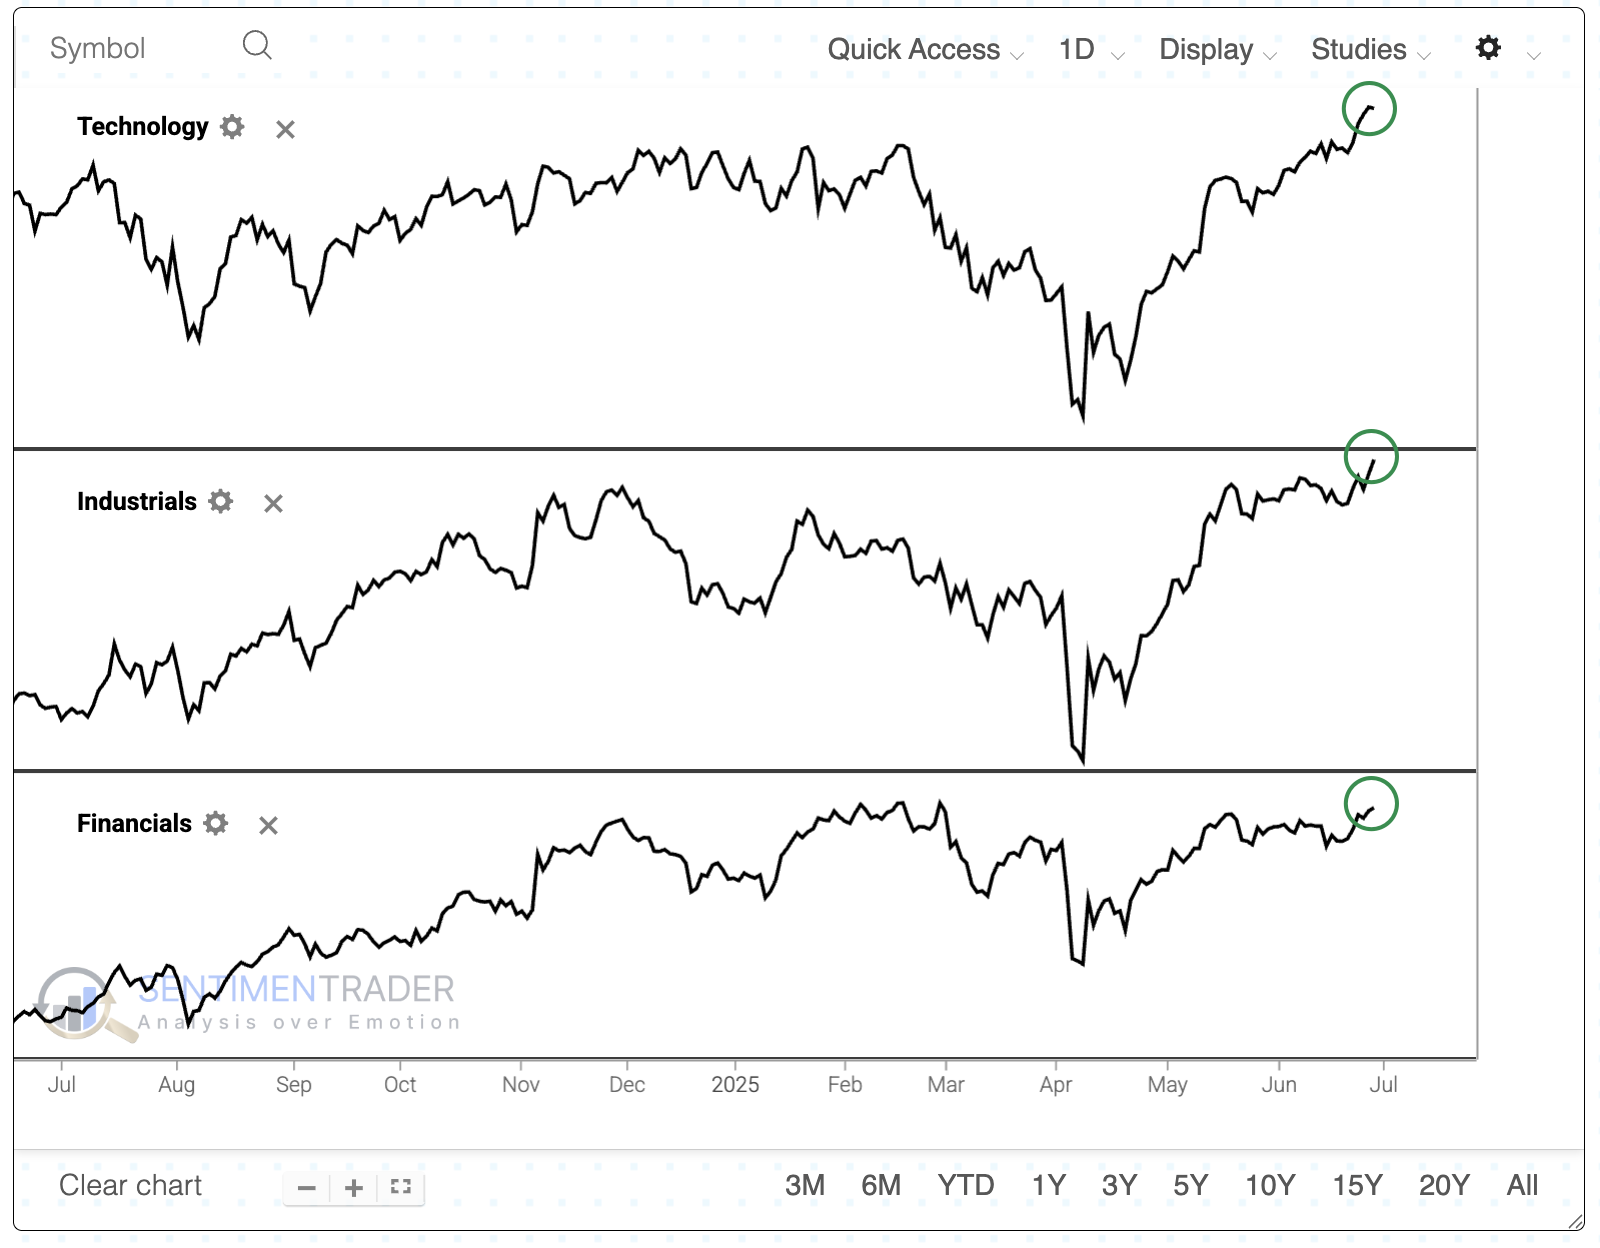
- Three of the most cyclical sectors hit record highs on Friday
- When those sectors lead all others to record territory, the broad market has rarely declined much
- Forward returns tended to be strong across sectors, with financials among the biggest beneficiaries
Cyclical success
It's been a good time to bet on the companies most geared toward a healthy economy.
More evidence is emerging that, despite whatever economics (and economists) suggest, investors are betting on growth. On Friday, three of the most cyclical sectors hit record highs: technology, industrials, and financials.
Remarkably, only one other sector - communications - also hit a new high, thanks to its reconstituted constituents. Outside of the three noted above, the median drawdown across all other sectors was -8.7%.
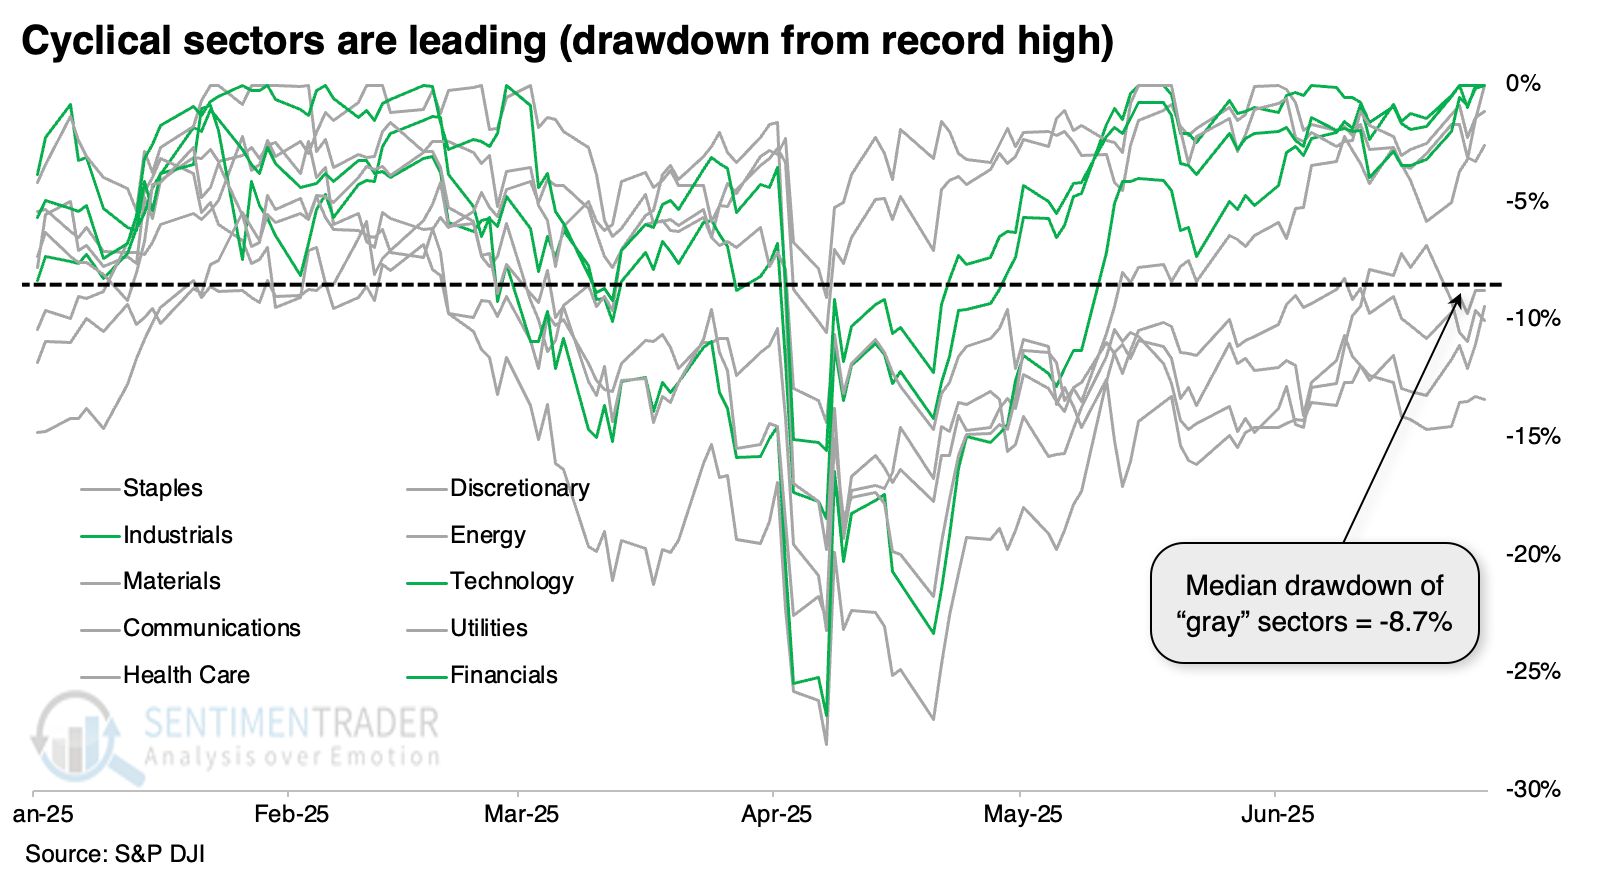
That drawdown among other sectors is notable because it's the largest in history. Since 1926, there have been 458 sessions when technology, industrial, and financial stocks closed in record territory on the same day. The median drawdown across the seven other major sectors on those days was only -0.4%. Friday was the first time in history that the average drawdown exceeded -7%.
This time is different than virtually all others because it's never happened with such a heavy drawdown across other sectors. But we can look at other times when those three sectors led and see what happened.
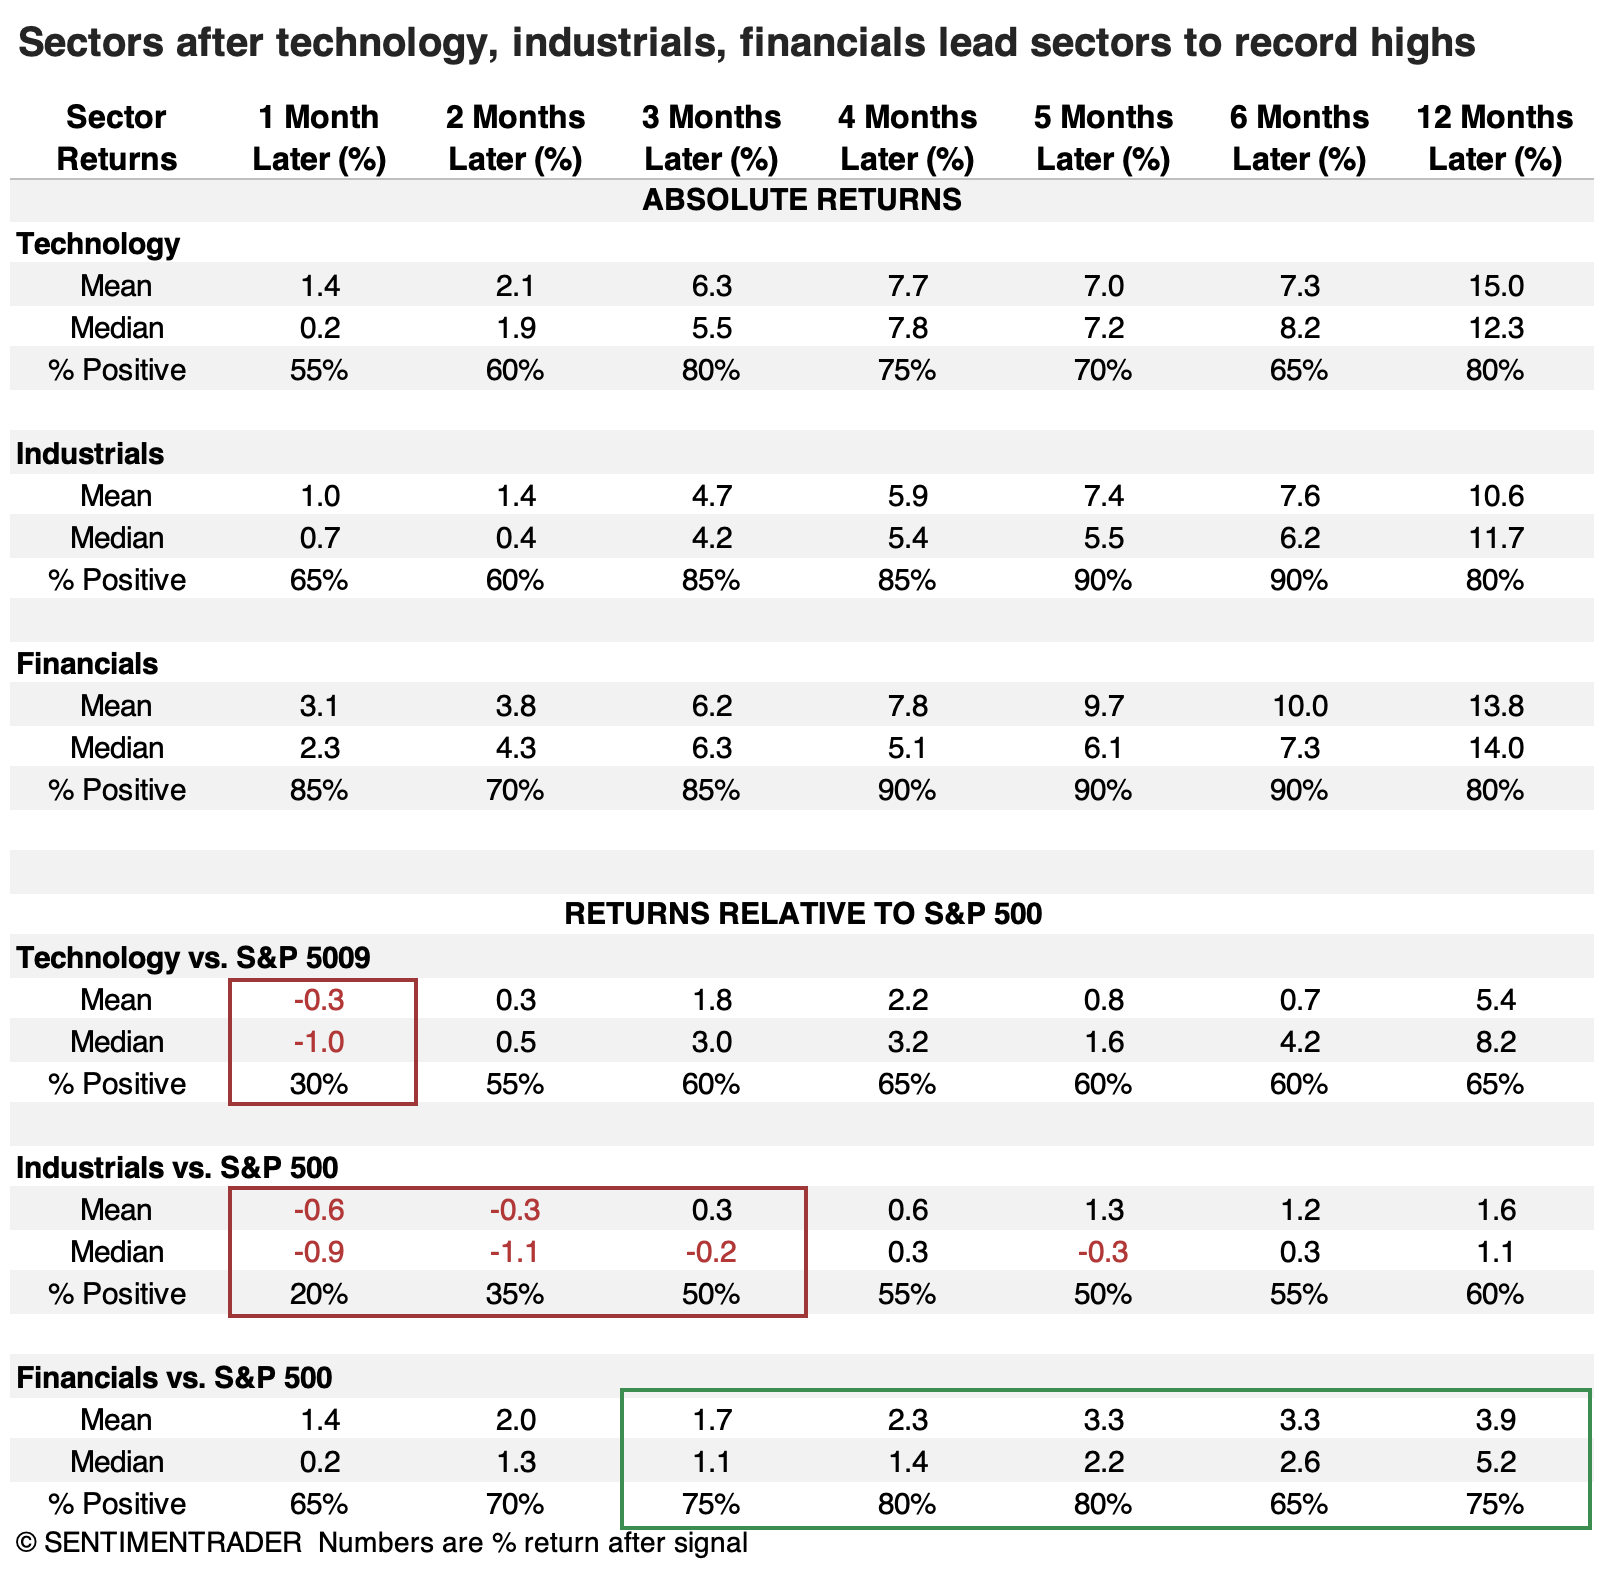
The table below shows those times. It includes all unique dates when technology, industrials, and financials hit a record high, and at the same time, only one other sector at most did so, and the average drawdown among the other seven sectors was at least -1%.
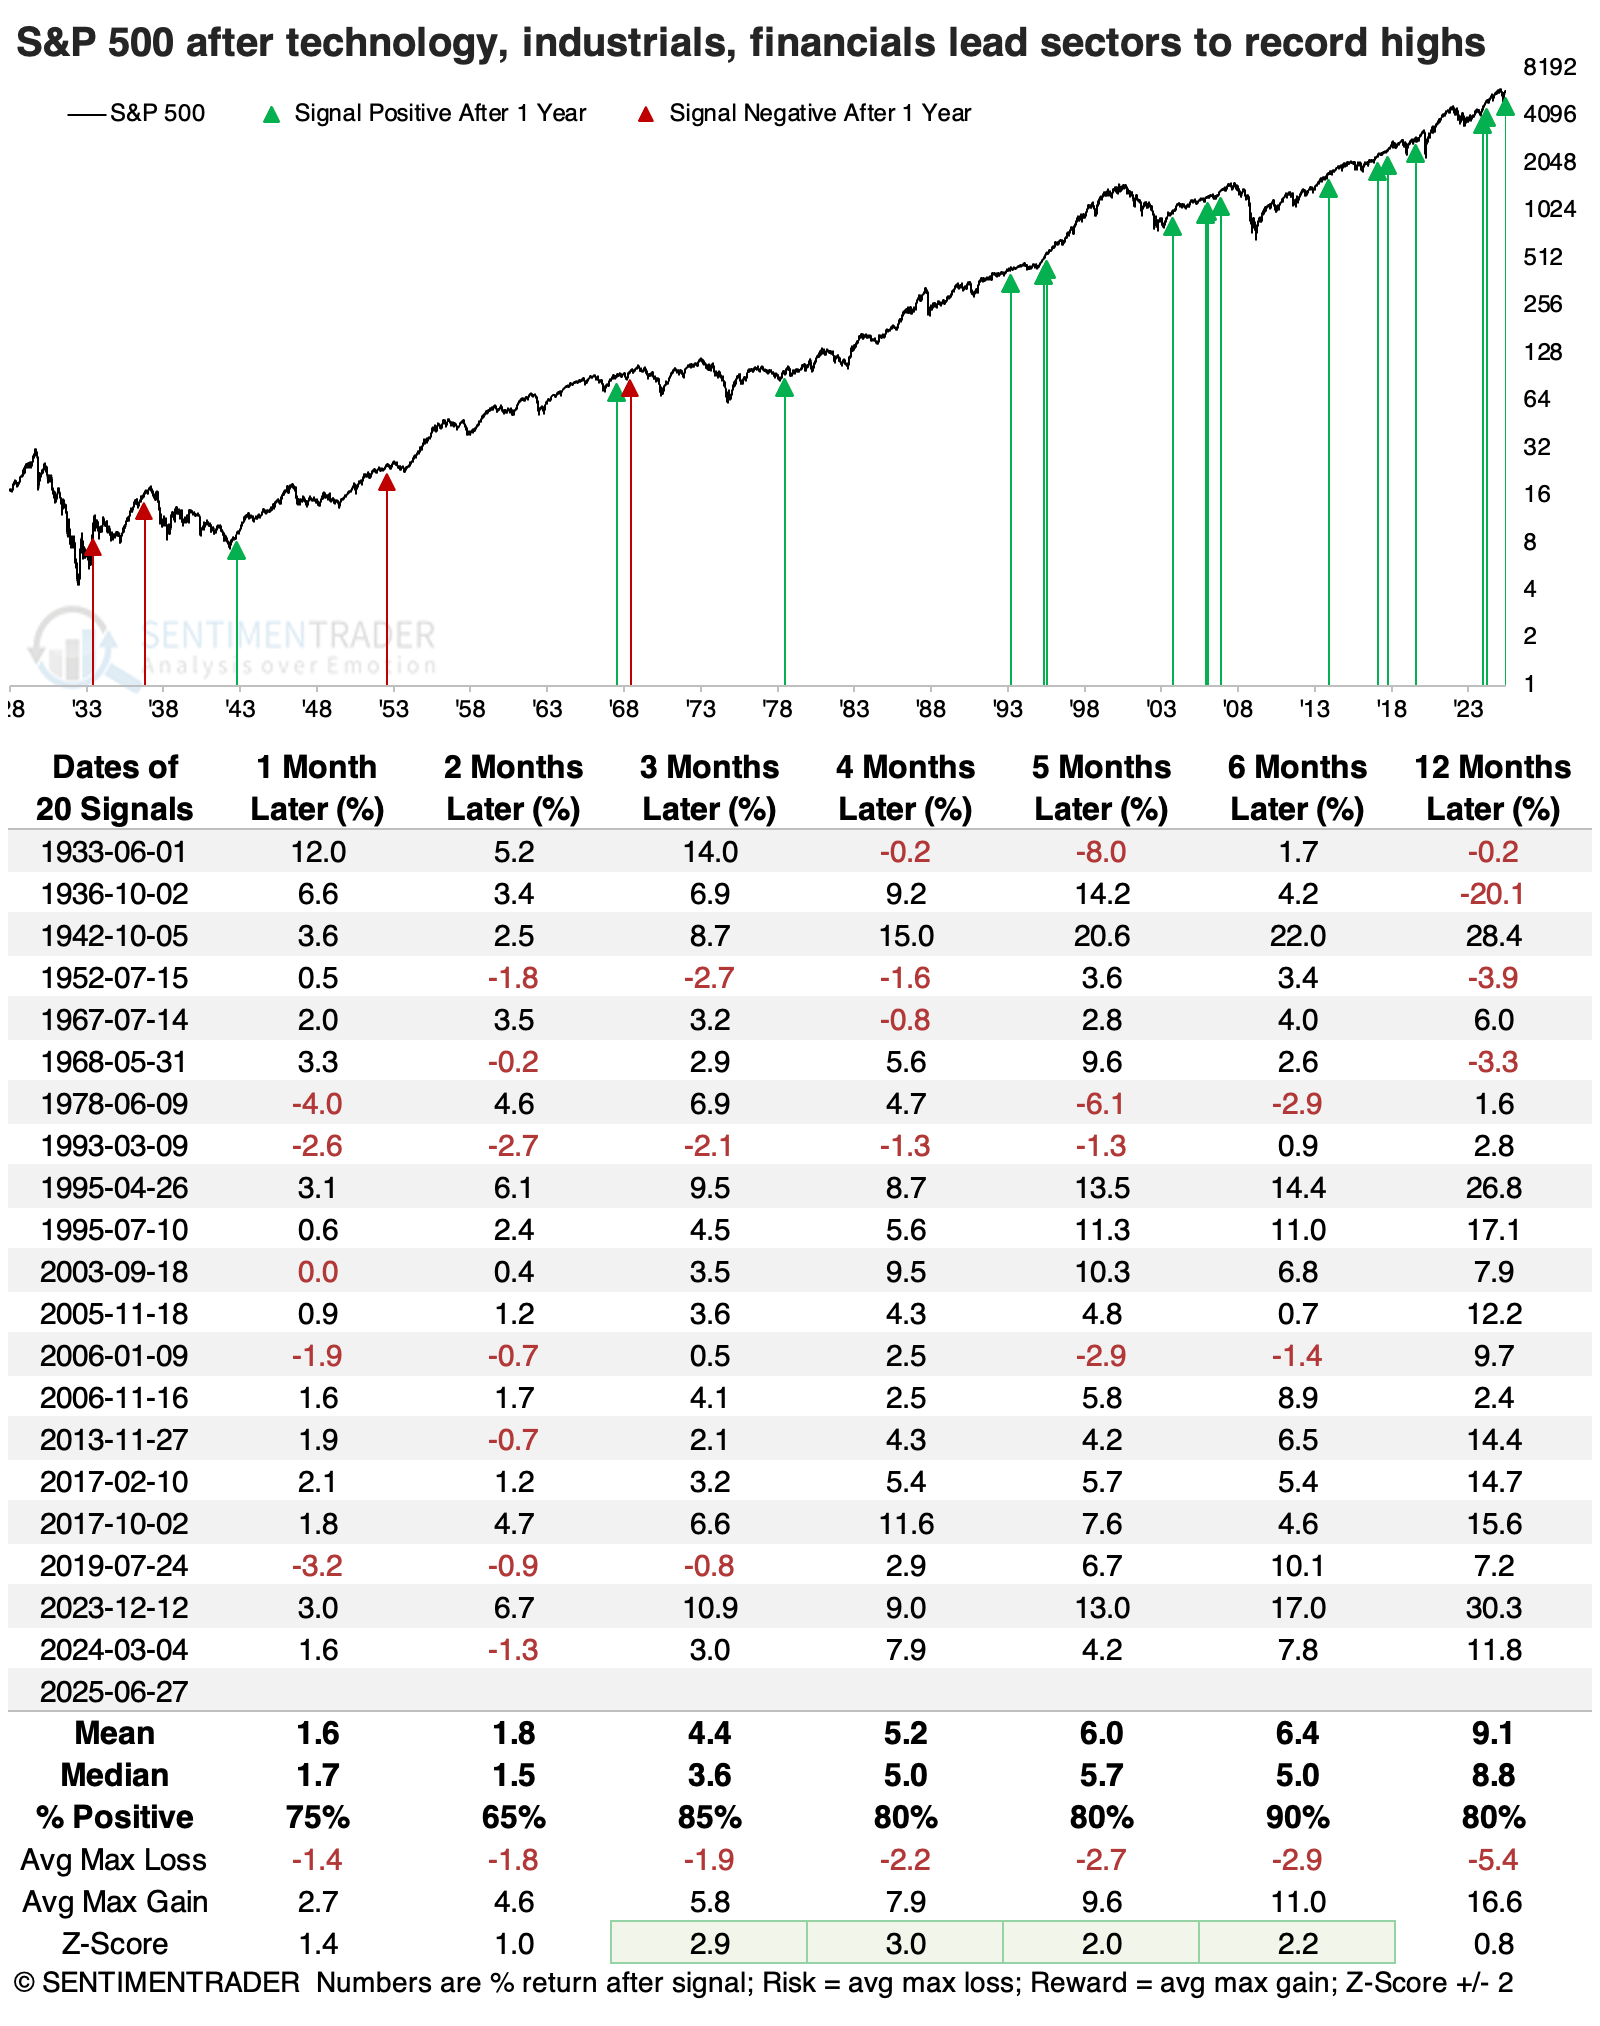
We can see quite clearly that this was not a problem, far from it. The S&P 500 performed exceptionally well in the months ahead, with a sweet spot being intermediate time frames. Six months later, the S&P was higher 18 out of 20 times, and the two losses were small and subsequently erased.
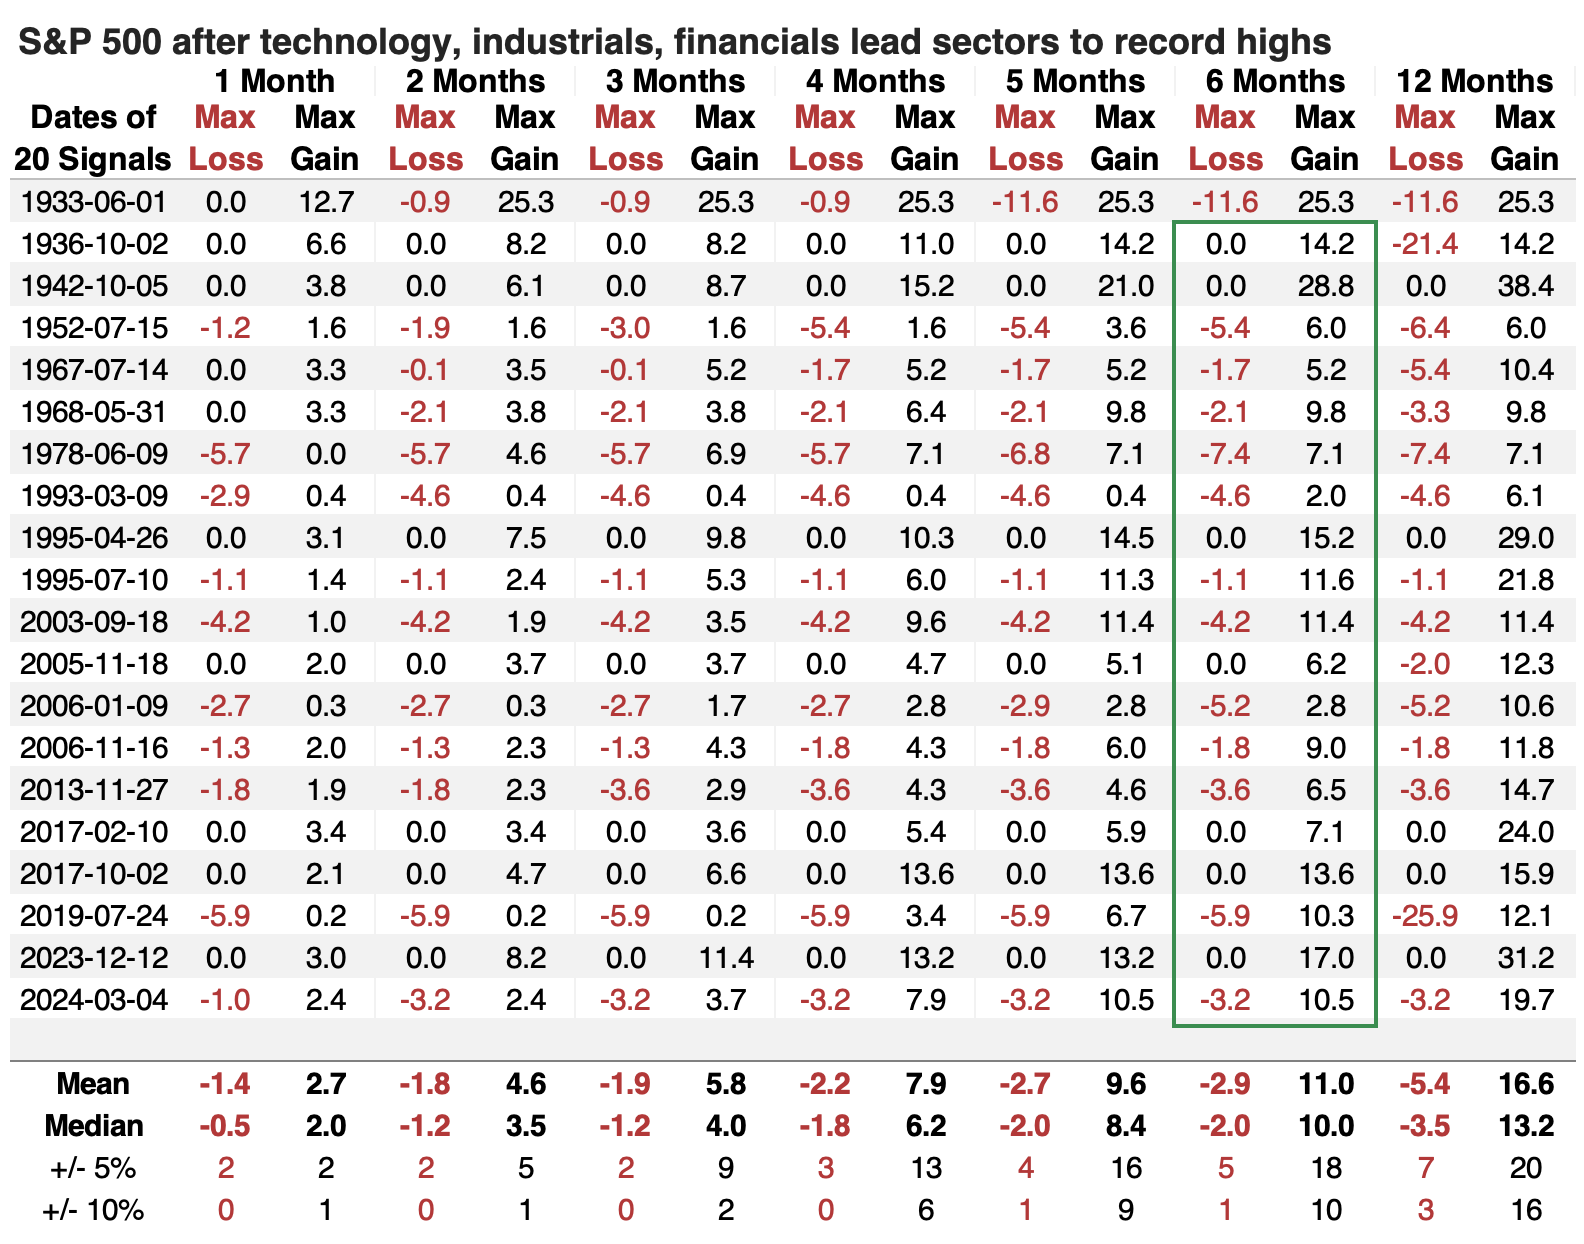
The risk/reward ratio was excellent across time frames. Remarkably, there was only one time, in 1933, when the S&P 500 lost more than -10% at any point within the following six months.
Each of the three sectors performed well after leading to new highs. Somewhat surprisingly, technology showed the least consistent positive returns. Relative to the S&P 500, financials were the clear winner. Both technology and industrials lagged over shorter time frames, while financials outpaced the broader market on all time frames, and consistently on longer ones.
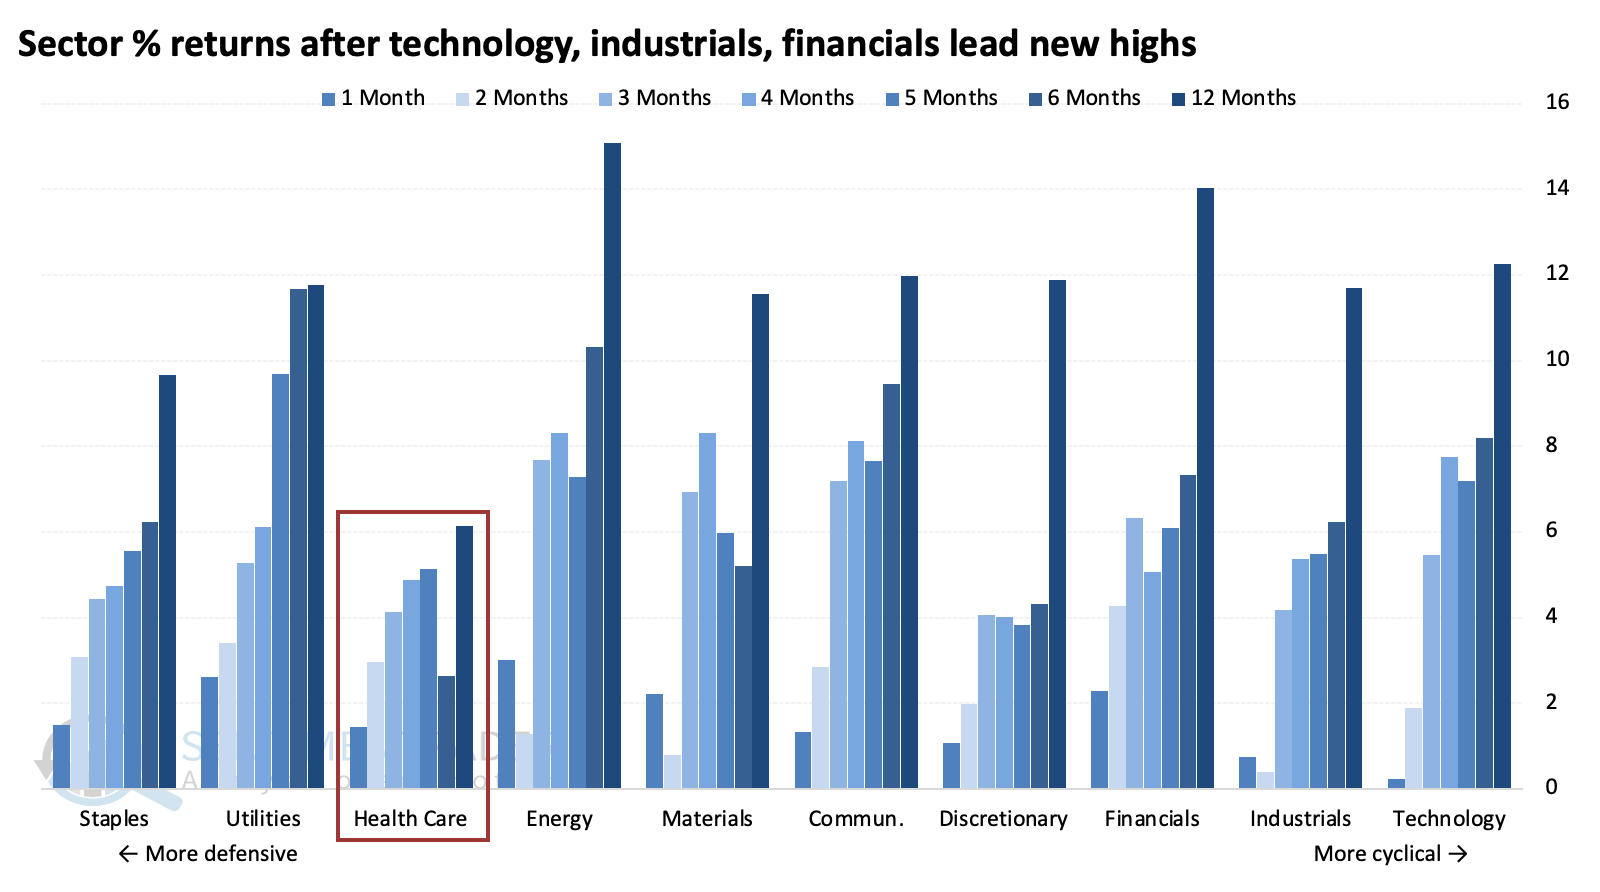
Returns across all sectors were pretty good. The biggest laggard was health care, which held up under shorter time frames but never really went much of anywhere after that, while other sectors tended to build on their gains.
What the research tells us...
When investors have confidence in cyclical sectors, it benefits pretty much all areas of the market. One of the biggest beneficiaries is the S&P 500 itself, a broad market stuffed with cyclical stocks (especially now). It has consistently gained in the months following breakouts in three of its sectors most geared toward a healthy economy. While all three of the leading sectors showed a strong tendency to rise in the months following their breakouts, their returns weren't too exceptional relative to the S&P 500. The best candidate for not only positive returns, but also outperformance, was the financial sector.