
2 economic clues for bitcoin

Key points
- Most crypto analyses focus on technical or structural inputs
- Instead, we can use economic factors to forecast prices
- The Purchasing Managers Index and M2 money supply offer clues regarding bitcoin's potential
Bitcoin versus the Purchasing Managers Index (PMI)
Crypto, and bitcoin in particular, is having a moment. Instead of the usual technical tools, investors can use economic data to help decide how much to allocate to this relatively new asset class.
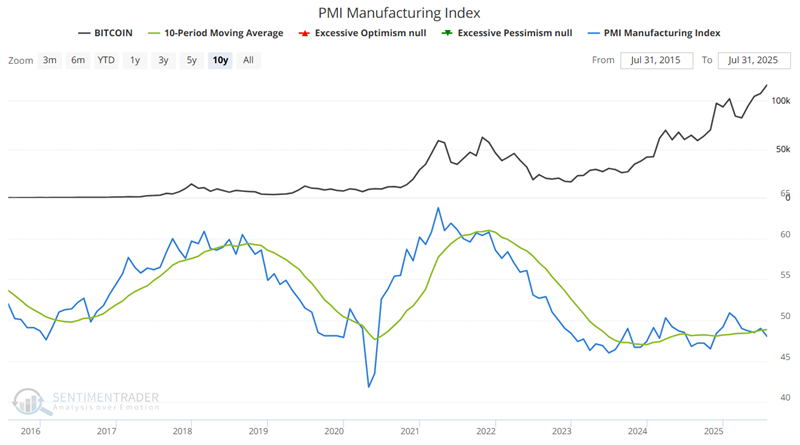
The Purchasing Managers' Index (PMI) is a key economic measure of the health and direction of the United States' manufacturing sector. Based on a monthly survey of purchasing and supply executives, the index tracks changes in new orders, production levels, employment, supplier deliveries, and inventories. A reading above 50 indicates expansion or growth in the manufacturing sector.
First, we compare the latest PMI reading to its 10-month moving average. A PMI reading above the 10-month average is considered favorable for bitcoin, while a reading below is neutral. As of the August 1st report, PMI is below its 10-month moving average, so it is presently neutral for bitcoin.
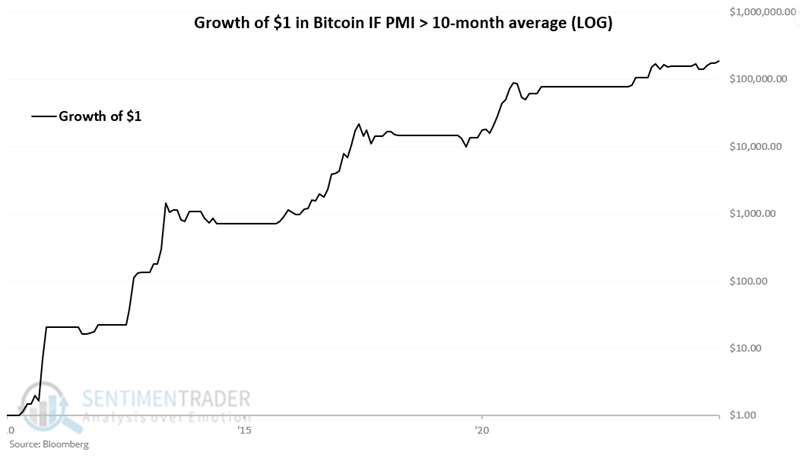
Below, we see the growth of $1 invested in bitcoin when the PMI Index was above its 10-month average. The cumulative hypothetical gain is an astounding 18,732,032%.
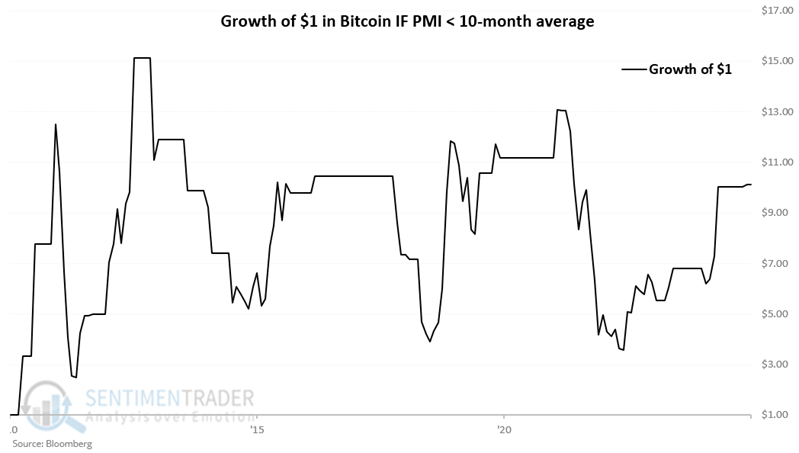
Investing only when the PMI Index was below its 10-month average gained 913%. That's still impressive relative to other assets but includes some massive drawdowns, and the equity curve is no higher now than in mid-2011.
Using M2 as an input
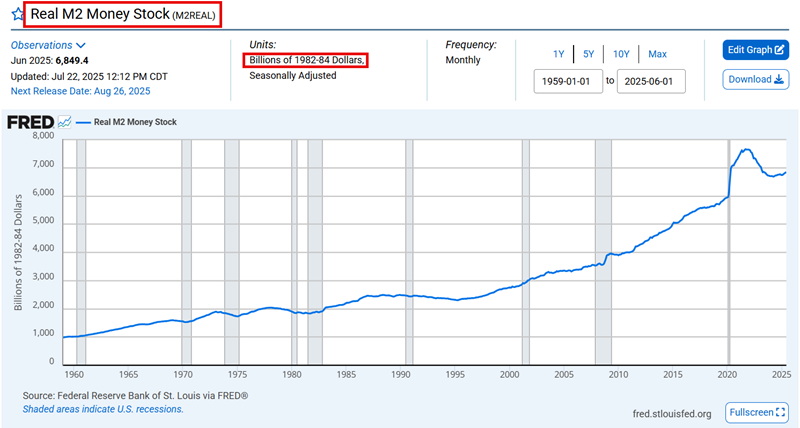
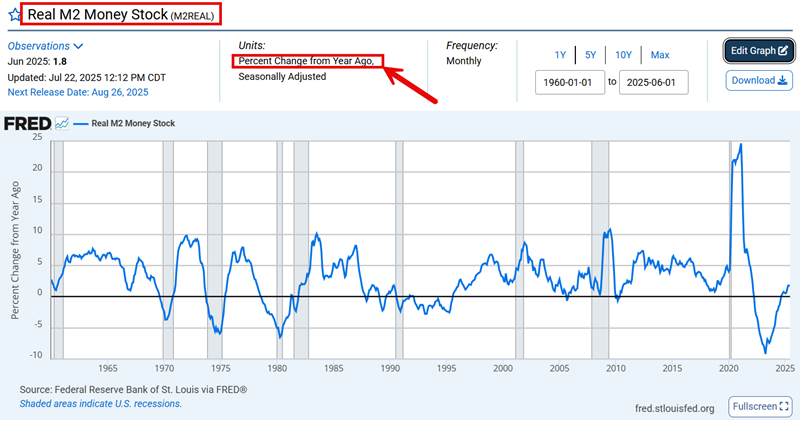
Real M2 is the U.S. Federal Reserve estimate of liquid assets, including cash on hand, money deposited in checking accounts, savings accounts, and other short-term saving vehicles such as money market funds and certificates of deposit (CDs). This data can be found at FRED.
We are more interested in M2's rate of change than its raw value. The chart below shows its 12-month rate of change.
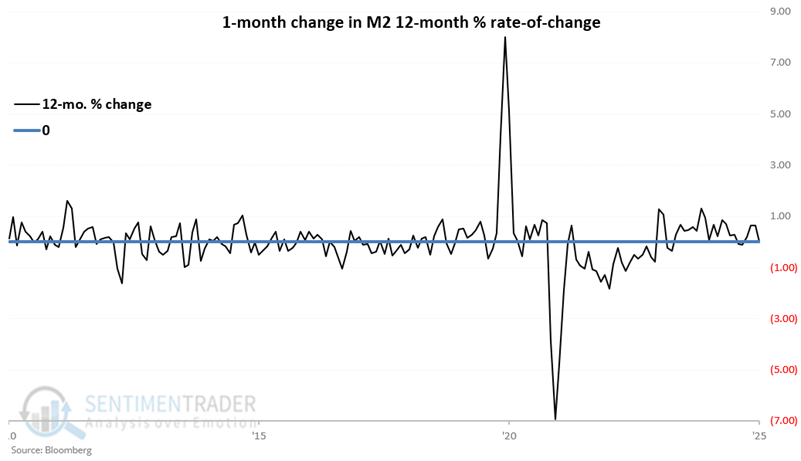
We're even more interested in whether the rate of change is increasing or decreasing.
The chart below shows the monthly difference in the rate of change. If it's above zero, M2 is increasing faster than the month before. Positive values are considered favorable for bitcoin, while negative values are neutral. This indicator is positive as of the end of July, so it is presently favorable.
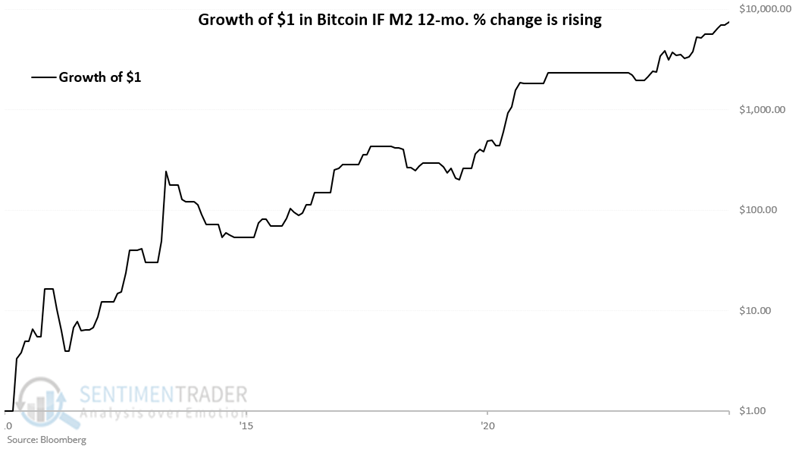
M2 data is updated mid-to-late month. However, to compare apples to apples, we will use the closing price for bitcoin on the first trading day of the month as the hypothetical buy or sell price.
Using these rules, $1 invested in bitcoin only with a positive M2 growth rate grew to a hypothetical 748,394%.
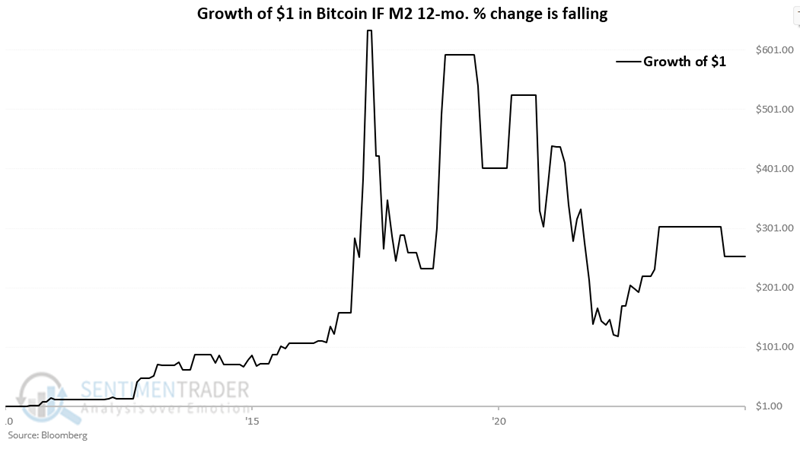
Investing in bitcoin only when growth was negative grew 25,263%. We're not suggesting that falling M2 is outright bearish for bitcoin; we only mean that the odds of an advance are less than if M2 is rising.
When M2 is rising, the equity curve generally slopes from lower left to upper right. The equity curve when M2 is falling has experienced massive swings, and presently stands 60% below its 2017 peak.
What the research tells us...
As a relatively new asset class, it has taken some time to identify factors that have a meaningful relationship with bitcoin price movements. As crypto represents a form of currency, it makes intuitive sense that economic and financial trends in the world's largest economy would have an impact.
The PMI Index and M2 indicators presented here should be viewed as weight-of-the-evidence indicators, not automatic trading systems. They show promise as inputs typically outside of what other investors are using. Currently, PMI is neutral for bitcoin, while M2 is favorable, so crypto investors may want to watch the latest releases to see how this may change for the coming month(s).