1-Month Low in Gold

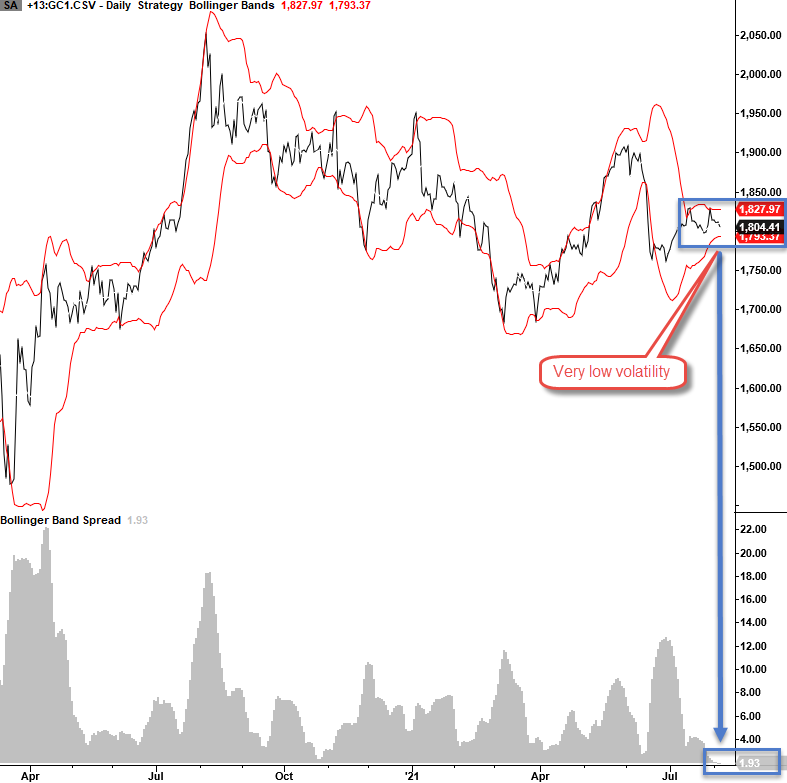
Gold Futures are registering a 1-Month low after what appears to be a solid employment report. While a 1-month low is not unusual, the price volatility in gold before today's trading session had fallen to a historically low level as measured by the spread between the upper and lower Bollinger band.
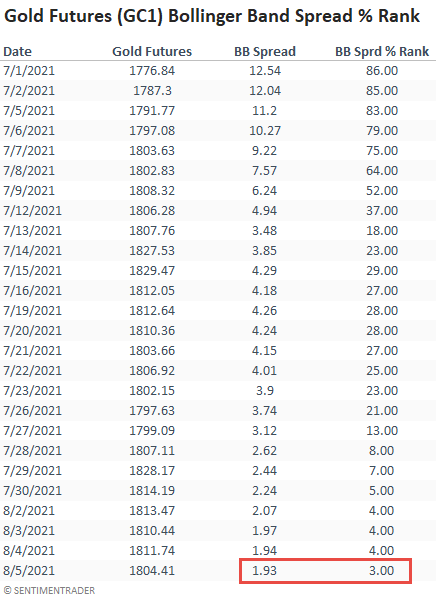
The following table contains the percentage spread between the upper and lower Bollinger band. As the table shows, the spread fell to 1.93% on 8/5/21. If I rank the value of 1.93% against all other instances since 1971, we can see that it fell to the 3rd percentile. So, that means 97% of the other spread values were higher over the last 50 years.
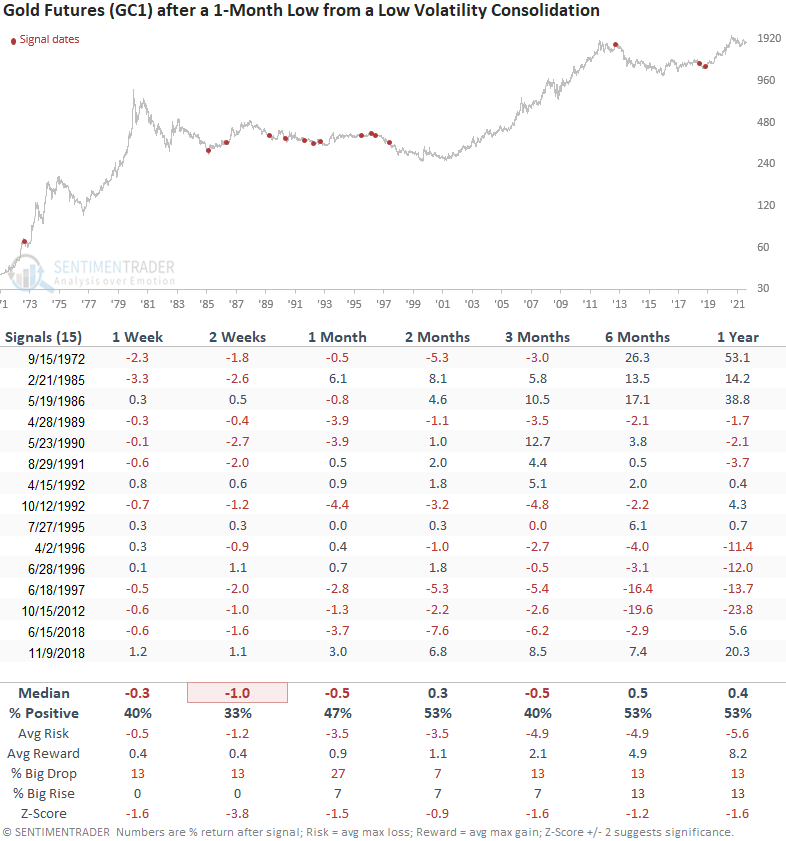
Let's conduct a study to assess the forward return outlook for Gold futures when the Bollinger band spread crosses below 2% and Gold registers a 1-month low within five trading days of the cross below 2%. i.e., the current scenario.
CURRENT DAY CHART
HOW THE SIGNALS PERFORMED
While performance looks weak across almost all timeframes, the 2-week results look alarming, especially the risk/reward profile.