Zweig Breadth Thrust; Strategists vs Analysts

This is an abridged version of our Daily Report.
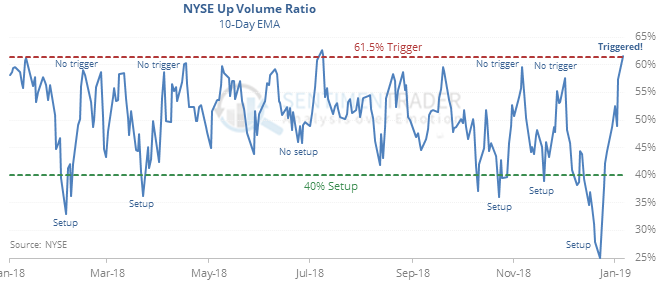
Triggered
This time is different. When we look at the declines and attempted recoveries since the trouble started in October, what has transpired since mid- to late December is markedly different than the ones that failed. This push off the lows has had enough oomph to trigger a Zweig Breadth Thrust.
When occurring in the midst of a 52-week low, these thrusts have a good long-term record. This one is all the more remarkable since the setup was among the most oversold in history, with only 1962 being able to match its extreme.
Strategists vs analysts
On Wall Street, strategists have been lowering their year-end S&P 500 price estimates, but the index was still recently more than 30% below those estimates, a discount last since in 2008. The bottom-up analysts on the Street have been much busier lowering price targets, to a point that has reached an extreme last seen at the end of panics in 2011 and 2016.
Whiplash
On Friday, we looked at big swings in the McClellan Oscillator. It’s gotten even more extreme. Since 1940, our current two-week period is only the 2nd to see the Oscillator go from less than -95 to greater than +95. The other was November 7, 1962. There were 3 times it went from -80 to +80 (November ’62, Jun ’70 and Mar ’09).
Persistent
The S&P 500 fund, SPY, managed to rise more than 0.75% even after the Short-term Optimism Index was 80 or above. This is atypical. If it continues to rise over the next week, then then following month added even more gains 5 out of 5 times.