
Yield curve worries look premature

Key points:
- Despite investor concerns, fewer than 10% of Treasury yield curves have inverted
- Recessions have tended to occur after more than 50% of curves inverted
- Returns after a rise in inversions were fine for stocks, especially Value factors
Treasury yield curves are starting to invert but have a ways to go
In early 2019, investors were becoming increasingly concerned about yield curve inversions. As we saw at the time, inversions across the curve were spiking, with several short-term maturities yielding more than longer-term maturities. Using 55 different combinations of Treasury yields from 11 different maturities ranging from 1 month to 30 years, more than half of the curves were inverted.
Historically, when more than half of the combinations inverted, a recession was close at hand. It ultimately rose above 65% of curves being inverted, a more consistent signal.
Headlines are stuffed once again with concerns about yield curves. But across maturities, inversion is still rare. Fewer than 10% of the combinations are currently inverted.
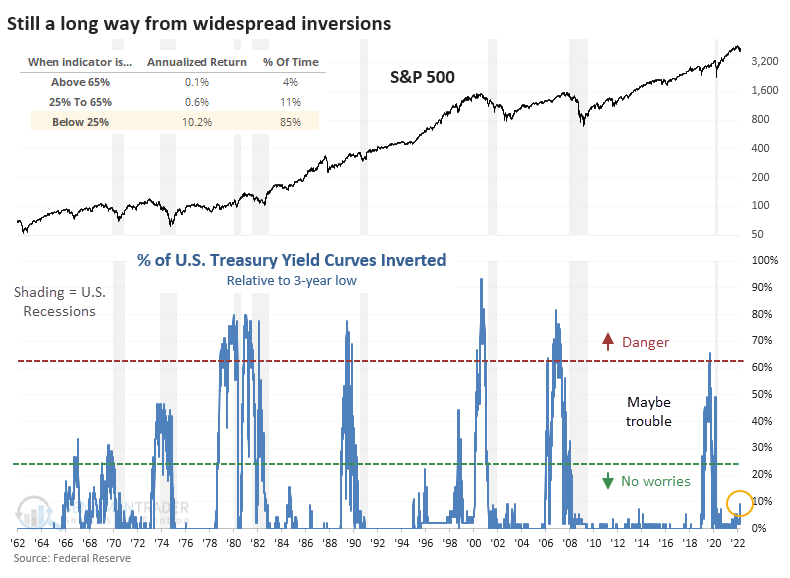
We can see from the chart that when fewer than 25% of the combinations are inverted, the S&P 500 showed an annualized return of more than +10%. When fewer than 10% of curves were inverted (like now), the annualized return climbed to +13.2%. Only when more than a quarter of the curves inverted did annualized returns start to really suffer.
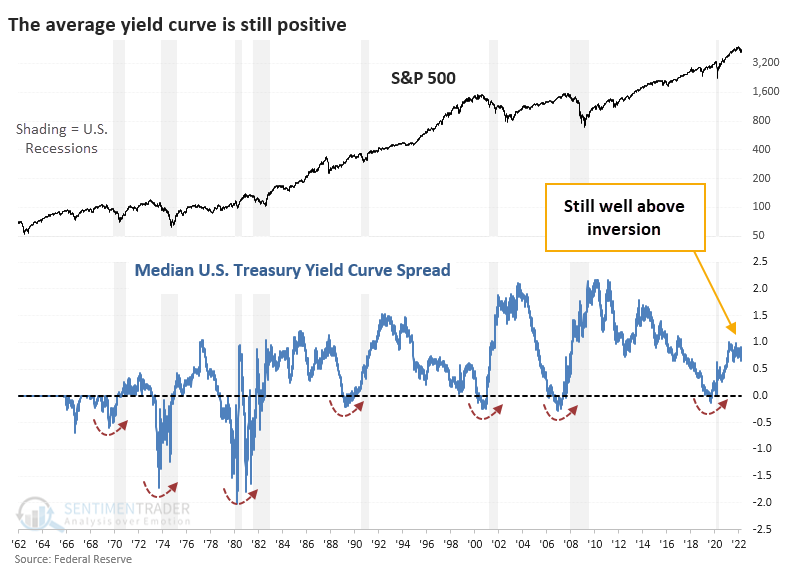
That's probably a ways off. The chart below shows the median spread between the different combinations. This dipped below zero before every recession in the past 60 years. It's still well above that point now; as of Wednesday, the median spread was in the top 29% of all readings since 1962. Since 1982, it's still well above the top half of all days.
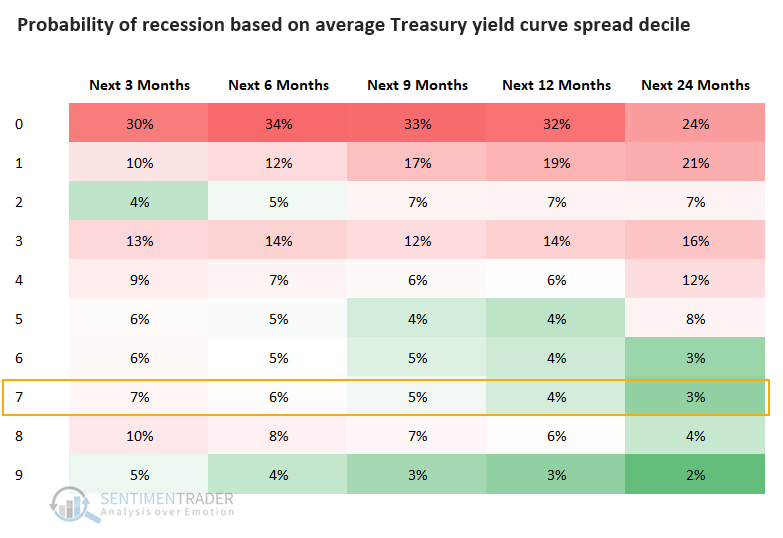
Based on where we are now relative to all other days, there's a very low probability that the U.S. would be in a recession across any time frame.
Returns have been fine after a modest rise in inversions
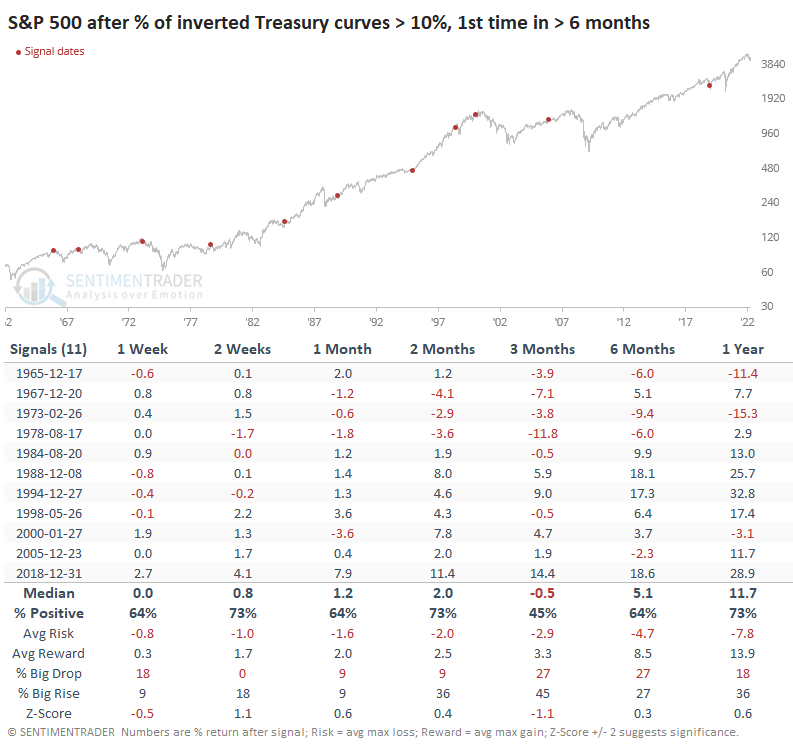
It hasn't happened yet, but once more than 10% of curves become inverted, the S&P 500 has shown weaker-than-average returns over the next 3 months, but that was the only medium- to long-term time frame with poor returns. And that was almost entirely thanks to the pre-1980 signals. A decent argument could be made that those signals (prior to 1982) are the most comparable to our current conditions. Stagflation worries, you know.
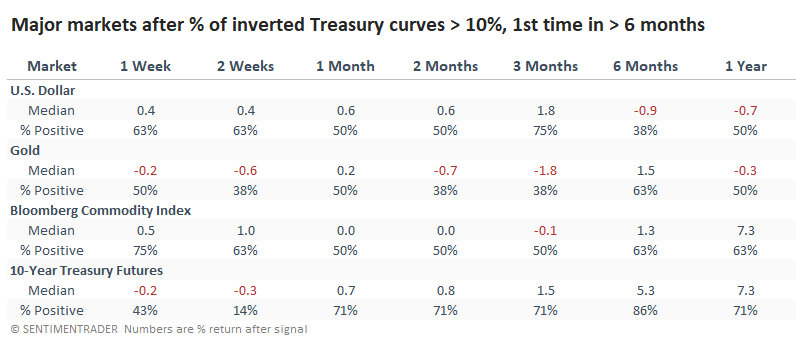
Among other major markets, the dollar tended to rise in the months following these signals, then decline longer-term. Gold was mixed but mostly weak. Commodities didn't show much at all, while Treasury futures suffered poor short-term returns but good medium- to long-term ones.
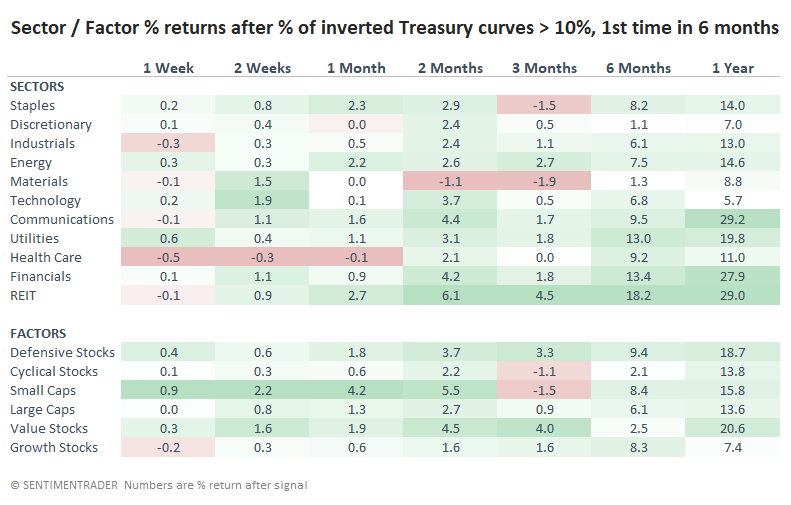
Financials and REITs did well after these signals. Others showed some decent rallies but weak returns over the next 3 months. Longer-term, Value stocks held up very well, rising 91% of the time and sporting an average return of more than +20% during the following year.
Other factors are still favorable
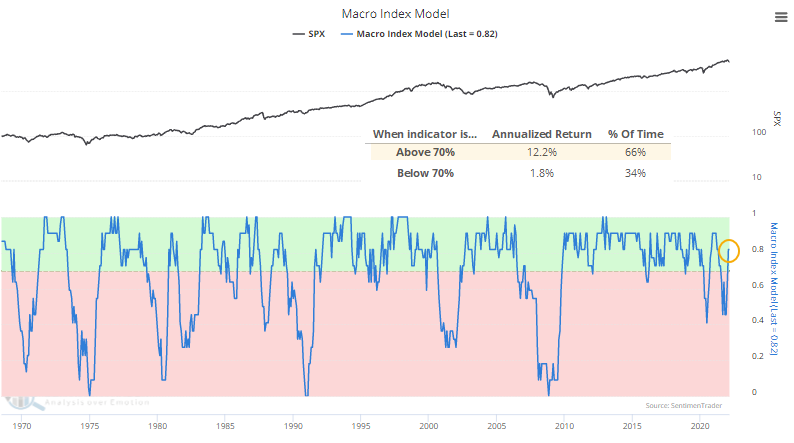
From a fundamental macro point of view, the Macro Index Model is still in healthy territory. Any month with a reading equal to or above 70% can be considered healthy. We'll get a fresh monthly reading during the first week of April.
Over the past 50+ years, the S&P 500 has returned +12.2% p.a. (per annum, or annualized percentage) when it was equal to or above 70% versus only +1.2% when it was below 70%. While there were some quick fakeouts, the most protracted declines in stocks occurred when this model was below 70%. The model dropped precipitously last fall, and we didn't enter a recession, but the decline in many speculative stocks has been dramatic.
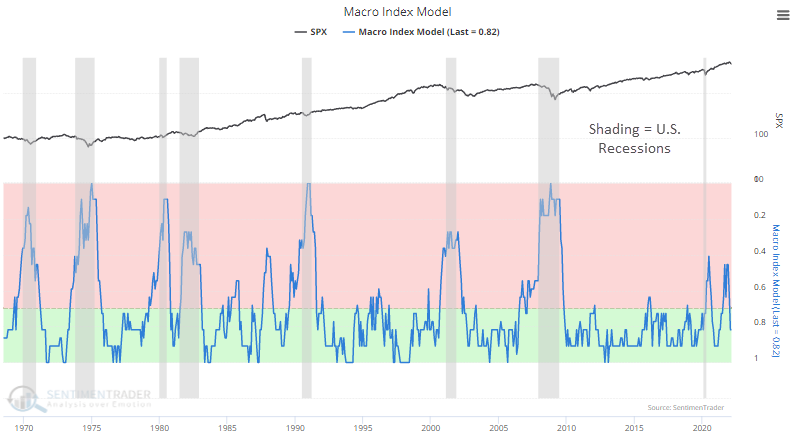
Or, you can invert the axis and get a rough approximation for the likelihood that we're in or about to enter a recession.
What the research tells us...
This is not a macro forecasting newsletter; there are much better sources for educated guesses on what might happen and which factors might most affect the U.S. economy. We take the data as they come and see if it has provided an edge. Currently, that data shows the concerns about the yield curve are premature. If more than a quarter of Treasury curves invert in the weeks and months ahead, we'd be more concerned. If that rises above 50%, we'd be a LOT more worried, especially in combination with a Macro Index Model below 70%.