Data &
Technology
Research
Reports
Report Solutions
Reports Library
Actionable
Strategies
Free
Resources
Simple Backtest Calculator
Simple Seasonality Calculator
The Kelly Criterion Calculator
Sentiment Geo Map
Public Research Reports
Free Webinar
Pricing
Company
About
Meet Our Team
In the News
Testimonials
Client Success Stories
Contact
Log inLoginSign up
< BACK TO ALL REPORTS

Why the Pounding of Value Stocks May Be Nearing an End

Jason Goepfert
2021-07-07
The ratio of Value to Growth stocks fell more than 7% over the past month, even while the ratio has been in an uptrend.

Much of what we've seen in our research since last fall has favored Value over Growth as the best opportunity to tilt a portfolio for forward returns without trying to predict overall market direction. 

That's been working but took a big hit in June. The total return ratio between the Russell 3000 Value Index versus the Growth Index tumbled more than 7.5% over the past month, one of the largest losses in years.

Value relative to Growth ratio

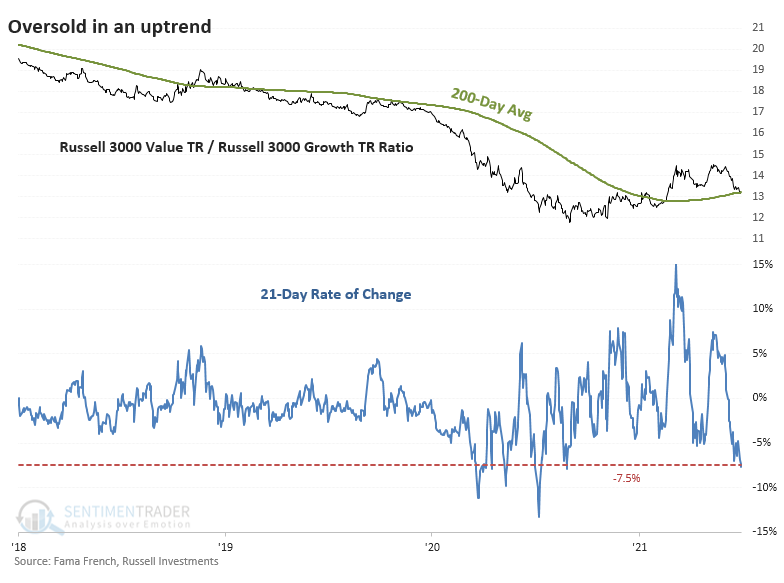
One difference with the recent losses is context - it's happening in an uptrend. Unlike the large rolling 1-month losses during much of 2020, the 200-day average of the Value/Growth Ratio is rising.

If we focus on large declines in the ratio only within uptrends, we can see that losses this large have typically resulted in the trend reasserting itself rather than sliding into another long-term downtrend. The ratio was extremely volatile in the 1930s, so many of the precedents were triggered then.

During modern markets, say since 1950, then things clear up a bit. Over the next 3-12 months, the ratio rebounded every time but once.


What else we're looking at

  • Full returns in Value, Growth, and Value vs. Growth stocks after big drops in the ratio
  • An update on absolute and relative trends across industry, sector, and country ETFs
  • Why soybeans may be headed for a trouble spot

Stat box

On Tuesday, the Nasdaq Composite closed at a new high with only 31% of its stocks advancing. That's the lowest percentage on any day with a new high since at least 1984. 

Etcetera

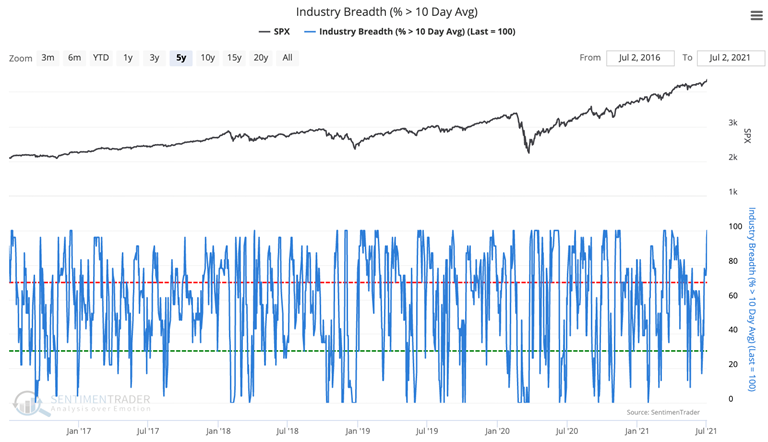
No breaks. Short-term Industry Breadth is the best it can possibly be, showing that 100% of 23 major U.S. industry indexes are trading above their 10-day moving averages.

percentage of industries above their 10 day moving average

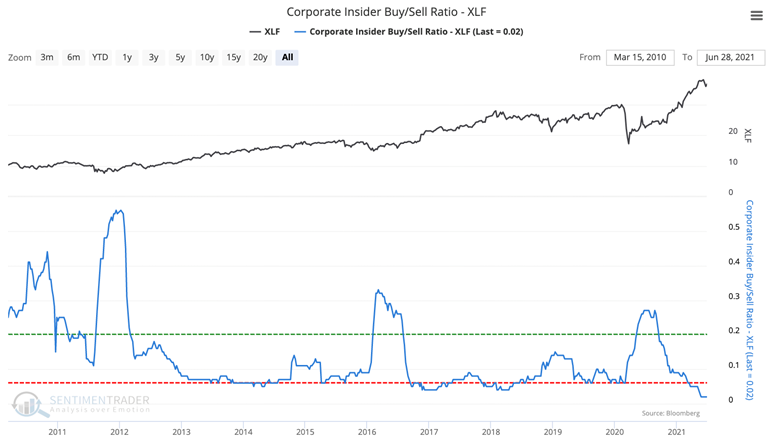
Undecided. The Corporate Insider Buy/Sell Ratio for financial stocks has continued to stay at its lowest point in history, with an overwhelming number of insiders selling stock relative to those buying.

xlf financials corporate insider buy sell ratio

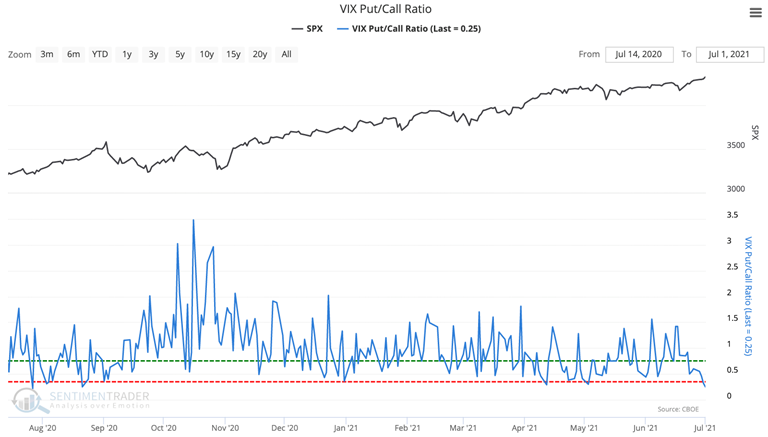
Call me? The VIX Put/Call Ratio has reached its lowest point since last July, dropping to 0.25 on Thursday. That shows traders are buying few contracts betting on a VIX decline relative to those betting the VIX will rise.

vix put call ratio

Our Backtest Engine allows users to test virtually every indicator our service offers in seconds. You can change indexes, parameters, trends, and lookback periods and see how it impacts future returns. We're working hard on version 2.0 which will allow even more flexibility.
DATA &
TECHnologies
IndicatorEdge
‍
BackTestEdge
‍
Other Tools
‍
DataEdge API
RESEARCH
reports
Research Solution
‍
Reports Library
‍
actionable
Strategies
Trading Strategies
‍
Smart Stock Scanner
‍
FREE
RESOUrCES
Simple Backtest
Calculator
Simple Seasonality
Calculator
The Kelly Criterion
Calculator
Sentiment Geo Map
‍
Public Research Reports
‍
Free Webinar
COMPANY
‍
About
‍
Meet our Team
‍
In the News
‍
Testimonials
‍
Client Success Stories
Pricing
Bundle pricing
‍
Announcements
‍
FAQ
© 2024 Sundial Capital Research Inc. All rights reserved.
Setsail Marketing
TermsPrivacyAffiliate Program
Risk Disclosure: Futures and forex trading contains substantial risk and is not for every investor. An investor could potentially lose all or more than the initial investment. Risk capital is money that can be lost without jeopardizing ones’ financial security or life style. Only risk capital should be used for trading and only those with sufficient risk capital should consider trading. Past performance is not necessarily indicative of future results.

Hypothetical Performance Disclosure: Hypothetical performance results have many inherent limitations, some of which are described below. No representation is being made that any account will or is likely to achieve profits or losses similar to those shown; in fact, there are frequently sharp differences between hypothetical performance results and the actual results subsequently achieved by any particular trading program. One of the limitations of hypothetical performance results is that they are generally prepared with the benefit of hindsight. In addition, hypothetical trading does not involve financial risk, and no hypothetical trading record can completely account for the impact of financial risk of actual trading. for example, the ability to withstand losses or to adhere to a particular trading program in spite of trading losses are material points which can also adversely affect actual trading results. There are numerous other factors related to the markets in general or to the implementation of any specific trading program which cannot be fully accounted for in the preparation of hypothetical performance results and all which can adversely affect trading results.

Testimonial Disclosure: Testimonials appearing on this website may not be representative of other clients or customers and is not a guarantee of future performance or success.