Indicators &
Backtest Tools
Research
Reports
Report Solutions
Reports Library
Strategies
& Scanner
Free
Resources
Simple Backtest Calculator
Simple Seasonality Calculator
The Kelly Criterion Calculator
Sentiment Geo Map
Public Research Reports
Free Webinar
Pricing
Company
About
Meet Our Team
In the News
Testimonials
Client Success Stories
Contact
Log inLoginSign up
< BACK TO ALL REPORTS

Why the Nasdaq's retracement is so important

Jason Goepfert
2022-04-06
The Nasdaq Composite has quickly retraced a majority of its decline, an important development. For this month, seasonality is favorable during the Election Cycle.

The Nasdaq's very quick retracement

In April 2020, we looked at the idea that it's the retracements that matter. At the time, technicians were griping about so-called Fibonacci retracements and the mystic fantasy that auction markets driven by semi-rational actors adhere to a cosmic sense of proportion. They don't. 

During bear markets, there typically is not a strong impulse among buyers, and stocks have a hard time retracing much of their decline. That is most certainly what did NOT happen in April/May 2020, and it's not what's happening right now.

Only 15 days from its latest 52-week low, the Nasdaq Composite has already retraced 56% of its decline. That's almost exactly the same retracement the Nasdaq clawed back in the first 15 days of the rally in 2020.

The Nasdaq's quick retracement

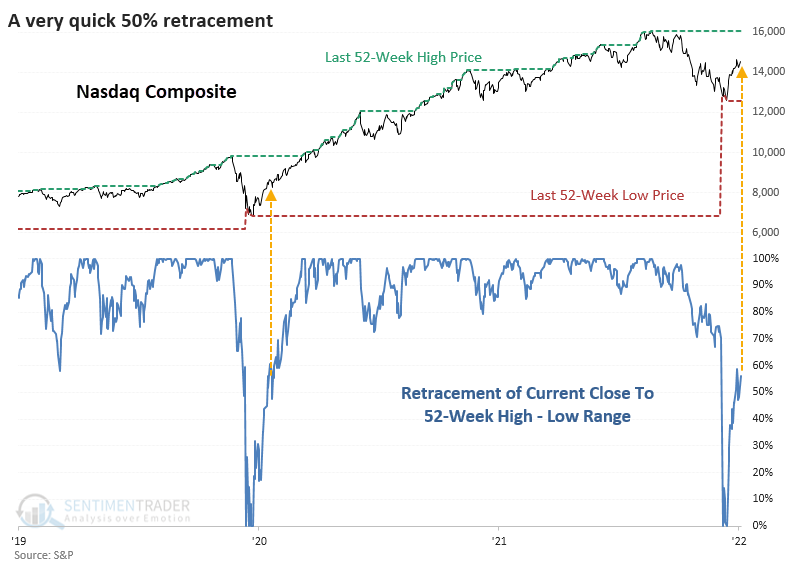
As we saw 2 years ago, swift and significant retracements of declines between an index's latest 52-week high and low have a strong tendency to occur at meaningful troughs.

There have been 12 retracements of 25% or more after 15 days from a low in the Nasdaq Composite's history. Over the next 2 months, there was only a single loss, and the risk/reward was massively skewed to the upside.

Contrast that to rallies that retraced less than 25% of their decline in the first 15 days. This was twice as common, and most of these ended up failing, leading to losses and lower lows. Bear markets tend to see weak buying pressure that falters quickly.

Seasonality and the election cycle

Jay views the Election Cycle as 12 months per year for four separate years - Post-Election, Mid-Term, Pre-Election, and Election. The theory is that the stock market performs better during certain months within this 48-month cycle than during other months. The full cycle appears in the table below.

The 18 months containing the word "Stocks" implies that we want to be in the stock market during these months. These are "favorable" months. Stocks are essentially neutral during months that do not contain the word "Stocks." They should not be considered outright bearish (although long-term results during these months have been quite unfavorable). 

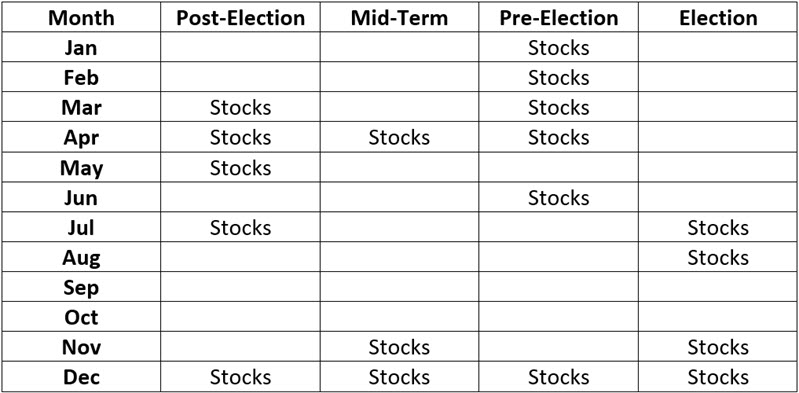
Note that April of 2022 is listed as a "favorable" month. Does this mean that stocks are guaranteed to trade higher this month? Not at all. For a better idea of what it does mean, from 12/31/1899 through 3/31/2022, the Dow Jones Industrial Average gained +587,733% during "favorable" months...and lost -84.8% during "unfavorable" months.

Indicators & Backtest Tools
IndicatorEdge
‍
BackTestEdge
‍
Other Tools
‍
DataEdge API
RESEARCH
reports
Research Solution
‍
Reports Library
‍
Strategies & Scanner
Trading Strategies
‍
Smart Stock Scanner
‍
FREE
RESOUrCES
Simple Backtest
Calculator
Simple Seasonality
Calculator
The Kelly Criterion
Calculator
Sentiment Geo Map
‍
Public Research Reports
‍
Free Webinar
COMPANY
‍
About
‍
Meet our Team
‍
In the News
‍
Testimonials
‍
Client Success Stories
Pricing
Bundle pricing
‍
Announcements
‍
FAQ
© 2024 Sundial Capital Research Inc. All rights reserved.
Setsail Marketing
TermsPrivacyAffiliate Program
Risk Disclosure: Futures and forex trading contains substantial risk and is not for every investor. An investor could potentially lose all or more than the initial investment. Risk capital is money that can be lost without jeopardizing ones’ financial security or life style. Only risk capital should be used for trading and only those with sufficient risk capital should consider trading. Past performance is not necessarily indicative of future results.

Hypothetical Performance Disclosure: Hypothetical performance results have many inherent limitations, some of which are described below. No representation is being made that any account will or is likely to achieve profits or losses similar to those shown; in fact, there are frequently sharp differences between hypothetical performance results and the actual results subsequently achieved by any particular trading program. One of the limitations of hypothetical performance results is that they are generally prepared with the benefit of hindsight. In addition, hypothetical trading does not involve financial risk, and no hypothetical trading record can completely account for the impact of financial risk of actual trading. for example, the ability to withstand losses or to adhere to a particular trading program in spite of trading losses are material points which can also adversely affect actual trading results. There are numerous other factors related to the markets in general or to the implementation of any specific trading program which cannot be fully accounted for in the preparation of hypothetical performance results and all which can adversely affect trading results.

Testimonial Disclosure: Testimonials appearing on this website may not be representative of other clients or customers and is not a guarantee of future performance or success.