Indicators &
Backtest Tools
Research
Reports
Report Solutions
Reports Library
Strategies
& Scanner
Free
Resources
Simple Backtest Calculator
Simple Seasonality Calculator
The Kelly Criterion Calculator
Sentiment Geo Map
Public Research Reports
Free Webinar
Pricing
Company
About
Meet Our Team
In the News
Testimonials
Client Success Stories
Contact
Log inLoginSign up
< BACK TO ALL REPORTS

When this happened before, stocks never lost

Jason Goepfert
2022-01-04
For a full week, more than 90% of S&P 500 stocks have traded above their 10-day moving averages.

Another thrust in participation

In early December, buying interest across stocks was broad and urgent. More than 80% of volume on the NYSE flowed into advancing securities, triggering a rare breadth thrust.

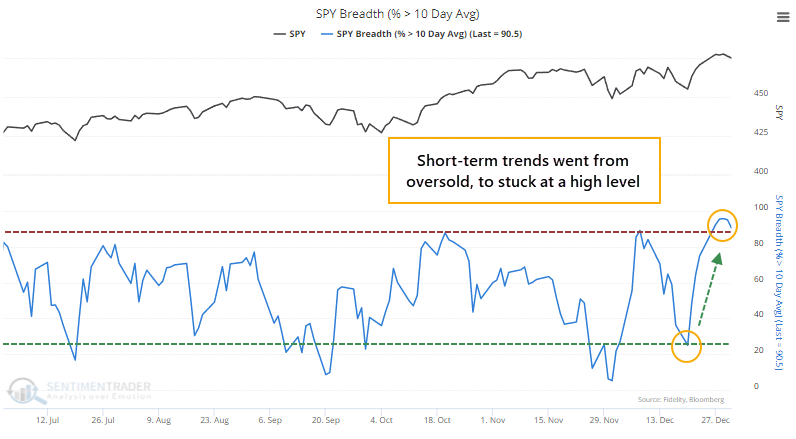
Within the most benchmarked index in the world, buying interest has been just as impressive. The percentage of S&P 500 member stocks trading above their 10-day moving averages cycled from only 25% on December 20 to more than 90% by last week.

More than 90% of S&P 500 stocks are above the 10 day moving average

Our Backtest Engine shows that since 1998, the S&P 500 performed well after more than 90% of its stocks traded above their 10-day averages, preceding a positive one-year return after 187 out of 193 signals. 

When these short-term trends cycled from below 25% (rounded) to above 90% on consecutive days, the S&P never lost ground over the next 6 months.

But it's even more impressive than that. By December 27, more than 90% of stocks were trading above their 10-day averages, and it hasn't dropped below 90% since then. This 5-day streak is tied for the 4th-longest since 1950.

Stat box

For only the 7th time in its history, the ProShares Ultra VIX Short-term Futures ETF (UVXY) declined for 9 consecutive days. Volatility tended to increase in the weeks following the prior signals.


Extending gold miners' seasonal window

In December, Jay noted a particular positive seasonal bias in gold mining stocks during the latter half of December.

Now let's consider the standard Santa Claus Miner Rally period during post-election years and extend the holding period through the close of January Trading Day of Month #11 in the mid-term election year.

The chart below displays the growth of $1 invested in HUI ONLY during the extended Santa Claus Miner Rally period every four years. 

Gold mining stocks favorable seasonal window

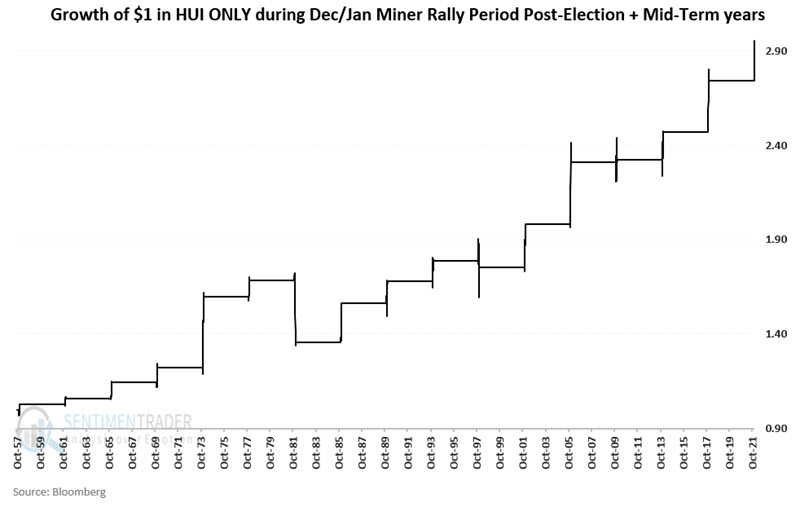
Out of 16 cycles, this pattern showed a profit 14 times.

If history proves an accurate guide, the rally in gold miners that started on 12/16 may extend through 1/18/2022. Nevertheless, traders must recognize the speculative nature of trading gold mining stocks and remember that significant loss is possible.

Indicators & Backtest Tools
IndicatorEdge
‍
BackTestEdge
‍
Other Tools
‍
DataEdge API
RESEARCH
reports
Research Solution
‍
Reports Library
‍
Strategies & Scanner
Trading Strategies
‍
Smart Stock Scanner
‍
FREE
RESOUrCES
Simple Backtest
Calculator
Simple Seasonality
Calculator
The Kelly Criterion
Calculator
Sentiment Geo Map
‍
Public Research Reports
‍
Free Webinar
COMPANY
‍
About
‍
Meet our Team
‍
In the News
‍
Testimonials
‍
Client Success Stories
Pricing
Bundle pricing
‍
Announcements
‍
FAQ
© 2024 Sundial Capital Research Inc. All rights reserved.
Setsail Marketing
TermsPrivacyAffiliate Program
Risk Disclosure: Futures and forex trading contains substantial risk and is not for every investor. An investor could potentially lose all or more than the initial investment. Risk capital is money that can be lost without jeopardizing ones’ financial security or life style. Only risk capital should be used for trading and only those with sufficient risk capital should consider trading. Past performance is not necessarily indicative of future results.

Hypothetical Performance Disclosure: Hypothetical performance results have many inherent limitations, some of which are described below. No representation is being made that any account will or is likely to achieve profits or losses similar to those shown; in fact, there are frequently sharp differences between hypothetical performance results and the actual results subsequently achieved by any particular trading program. One of the limitations of hypothetical performance results is that they are generally prepared with the benefit of hindsight. In addition, hypothetical trading does not involve financial risk, and no hypothetical trading record can completely account for the impact of financial risk of actual trading. for example, the ability to withstand losses or to adhere to a particular trading program in spite of trading losses are material points which can also adversely affect actual trading results. There are numerous other factors related to the markets in general or to the implementation of any specific trading program which cannot be fully accounted for in the preparation of hypothetical performance results and all which can adversely affect trading results.

Testimonial Disclosure: Testimonials appearing on this website may not be representative of other clients or customers and is not a guarantee of future performance or success.